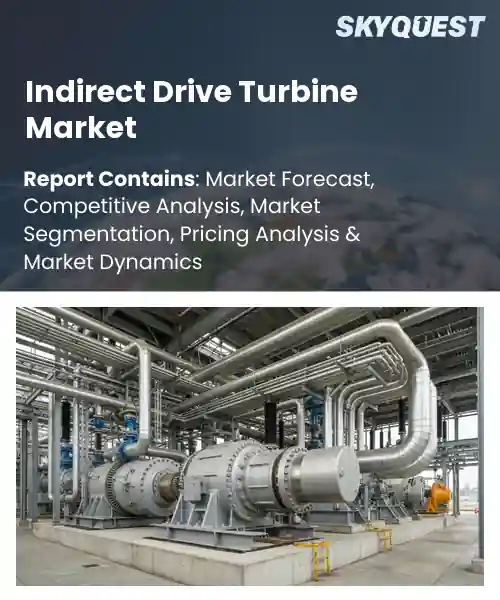
Indirect Drive Turbine Market
Report ID: SQMIG20I3390
Report ID: SQMIG20I3390
[email protected]
USA +1 351-333-4748
Report ID:
SQMIG20I3390 |
Region:
Global |
Published Date: July, 2026
Pages:
157
|Tables:
144
|Figures:
78


Global Indirect Drive Turbine Market size was valued at USD 528.4 Million in 2024 and is poised to grow from USD 557.99 Million in 2025 to USD 862.86 Million by 2033, growing at a CAGR of 5.6% during the forecast period (2026-2033).
The global indirect drive turbine market comprises systems in which a motor or generator drives a turbine via a gearbox rather than a shaft connection, enabling placement and speed control. This architecture matters because it decouples turbine speed from constraints, allowing aerospace, marine, and power‑generation applications to achieve higher efficiency and lower acoustic signatures. Historically the market emerged in the 1990s with electric motors for aircraft auxiliary power units; by the 2010s, advances in composites and control algorithms expanded adoption to offshore wind platforms. Today, the market is valued at several billion dollars, reflecting growth driven by demand for propulsion. Regulatory pressure to cut carbon emissions drives the indirect drive turbine market because stricter standards force manufacturers to seek higher efficiency and lower noise solutions. This demand translates into adoption of turbines for hybrid‑electric propulsion in regional aircraft and for energy‑recovery systems on ships. Consequently, firms such as GE Aerospace and Siemens Gamesa have launched joint‑development programs that employ magnetic‑bearing gearboxes, reducing parasitic losses by up to 15 percent. These efforts generate new revenue streams, broaden market entry in Europe and Asia, and position indirect drive turbines as core components of next‑generation low‑carbon global transport for sustainable logistics worldwide today.
How is AI-driven automation influencing efficiency in the indirect drive turbine market?
AI‑driven automation is reshaping the indirect drive turbine sector by embedding intelligent sensors and advanced analytics into every stage of turbine operation. Predictive maintenance platforms now scan vibration, temperature and torque data in real time, alerting operators to wear before a fault occurs. Design teams use generative AI to model blade shapes that capture more wind while reducing material use, and digital twins simulate performance across seasons, allowing operators to fine‑tune control strategies without costly field trials. The result is less unplanned downtime, smoother power output and lower operating costs, making turbines more attractive to project developers and utilities seeking reliable renewable energy. These capabilities are becoming standard as manufacturers integrate AI into their product roadmaps, driving a noticeable uplift in overall market efficiency.In June 2025, a leading turbine manufacturer introduced AI‑driven control software that synchronizes blade pitch and generator load, cutting idle time and boosting overall plant output, supporting market growth.
Market snapshot - (2026-2033)
Global Market Size
USD 528.4 Million
Largest Segment
Steam Turbines
Fastest Growth
Hydraulic Turbines
Growth Rate
5.6% CAGR
To get more insights on this market click here to Request a Free Sample Report
Global indirect drive turbine market is segmented by turbine type, power rating, application, end user, installation and region. Based on turbine type, the market is segmented into Steam Turbines, Gas Turbines and Hydraulic Turbines. Based on power rating, the market is segmented into Below 1 MW, 1–10 MW and Above 10 MW. Based on application, the market is segmented into Power Generation, Industrial Drives and Marine Propulsion. Based on end user, the market is segmented into Utilities, Oil & Gas, Manufacturing and Marine. Based on installation, the market is segmented into New Installation and Retrofit. Based on region, the market is segmented into North America, Europe, Asia Pacific, Latin America and Middle East & Africa.
Gas turbines segment dominates because indirect drive configurations uniquely match the high‑speed rotational dynamics required for efficient power conversion in compact footprints. Their ability to operate over a broad temperature range and integrate seamlessly with advanced control systems enhances reliability for demanding environments. Consequently, OEMs prioritize gas turbine solutions to meet performance targets while minimizing maintenance burdens, reinforcing their leadership in the indirect drive turbine market overall industry future growth.
On the other hand, hydraulic turbines segment emerges as the most rapidly expanding area because renewable water based projects are receiving heightened policy support and investors are seeking low emission energy sources. The adaptability of indirect drives to variable flow conditions accelerates adoption, unlocking installation opportunities and driving market diversification.
Power generation segment dominates because indirect drive turbines provide the precise speed control and high efficiency needed for large scale electricity production while reducing mechanical complexity. Their robust thermal performance and ability to synchronize with grid requirements foster long term operational stability, making them the preferred choice for new plants and upgrades. This alignment with utility reliability standards reinforces their preeminence in the indirect drive turbine market global industry future.
Meanwhile, industrial drives segment is witnessing the strongest growth momentum because manufacturers are embracing performance motor solutions to enhance production efficiency and meet targets. Indirect drive turbines enable torque control and reduced energy loss, prompting widespread adoption across lines. This surge expands the market footprint and creates revenue streams for providers.
To get detailed segments analysis, Request a Free Sample Report
Europe’s leadership in the indirect drive turbine market stems from a convergence of strong engineering heritage, extensive policy frameworks that prioritize low‑carbon power, and a mature offshore wind ecosystem. Long‑standing collaboration between turbine manufacturers, research institutes, and utilities creates a seamless supply chain from component design to large‑scale deployment. The region’s commitment to renewable energy targets drives steady investment in advanced turbine technologies, while stringent environmental standards encourage continual efficiency improvements. The presence of numerous certification bodies and harmonized standards across member states accelerates market entry for new designs, while a highly skilled engineering workforce sustains rapid prototyping and testing cycles. Moreover, public‑private financing instruments de‑risk large projects, enabling manufacturers to scale production without compromising quality.
Indirect Drive Turbine Market in Germany benefits from a deep industrial foundation that combines precision engineering with a strong emphasis on renewable integration. Leading manufacturers collaborate closely with research universities to refine aerodynamic concepts and drive material innovations. Government incentives that prioritize offshore wind installations create a reliable pipeline of projects, while a mature supply network ensures timely availability of high‑quality components, reinforcing Germany’s reputation as a technology hub for global export.
Indirect Drive Turbine Market in the United Kingdom is propelled by a proactive regulatory environment that encourages offshore wind capacity growth. Collaborative clusters linking turbine OEMs, marine engineering firms, and port authorities accelerate project delivery and reduce logistical barriers. Academic institutes contribute cutting‑edge research in blade dynamics and control systems, while a focus on domestic supply chain development strengthens resilience and creates skilled employment opportunities throughout the region for the national energy transition.
Indirect Drive Turbine Market in France leverages a strong legacy of aerospace and energy engineering, translating high‑performance design expertise into turbine efficiency gains. Strategic partnerships between national research agencies and turbine producers foster innovation in rotor aerodynamics and noise mitigation. Incentive frameworks that support coastal wind farms stimulate demand, while a coordinated logistics network along Atlantic ports ensures smooth component transport. This synergy positions France as a pivotal contributor to the European turbine ecosystem.
The Asia Pacific region is experiencing swift expansion of the indirect drive turbine market due to a confluence of ambitious renewable energy goals, expansive coastal wind resources, and a manufacturing ecosystem that emphasizes scale and cost efficiency. Governmental roadmaps prioritize offshore and near‑shore wind projects, creating a steady pipeline that attracts both domestic and international OEMs. Strong engineering talent pools, particularly in Japan and South Korea, enable rapid prototyping and technology transfer, while collaborative research institutions drive advances in blade materials and digital control. The rising focus on decarbonization in industry also raises demand for dependable turbine platforms, while regional financing tools supply risk‑adjusted capital for large deployments. These forces together speed adoption and underline the strategic role of indirect drive technology in the energy transition.
Indirect Drive Turbine Market in Japan is reinforced by longstanding expertise in machinery and commitment to offshore wind expansion. Collaboration between leading OEMs and university research centers drives improvement in turbine aerodynamics and reliability. Government incentives that streamline permitting processes accelerate project timelines, while a domestic supply chain for gearboxes and power electronics ensures component availability. These elements collectively position Japan as a participant in the broader regional turbine landscape.
Indirect Drive Turbine Market in South Korea is accelerated by a manufacturing base that excels in components and drive systems. Cooperation between industrial conglomerates and national research labs yields advancements in turbine control algorithms and lightweight blade designs. Policy frameworks that earmark offshore wind zones stimulate project initiation, while export‑focused strategies expand Korea’s presence in supply chains. These dynamics cement South Korea as an emerging innovator in indirect drive technology.
North America is solidifying its role in the indirect drive turbine market through a blend of policy encouragement, robust financing ecosystems, and deep engineering talent across the United States and Canada. Decarbonization agendas drive utilities to pursue offshore and onshore wind projects that rely on high‑efficiency turbines, prompting OEMs to scale production and embed advanced materials. Academic‑industry partnerships accelerate the development of digital twins and predictive maintenance tools, enhancing turbine availability. A well‑established supply chain for power electronics and composite components reduces lead times, while supportive regulatory frameworks streamline permitting. The growing emphasis on grid resilience also spurs integration of turbine storage solutions, further diversifying market opportunities. Collectively these factors elevate North America’s competitiveness and position the region as a key contributor to the next generation of turbine technology.
Indirect Drive Turbine Market in the United States benefits from offshore wind initiatives and a supply chain that includes component manufacturers. Research programs between federal labs and industry accelerate innovations in rotor efficiency and control systems. Financial incentives that de‑risk capital deployment encourage rapid project rollout, while a skilled workforce supports turbine assembly and maintenance. These strengths position the United States as a leading driver of indirect drive technology adoption.
Indirect Drive Turbine Market in Canada draws on an emphasis on clean energy transition and coastal wind resources. Partnerships between provincial utilities and turbine manufacturers foster adaptations suited to colder climates. Government programs that streamline procurement and provide fiscal support reduce project barriers, while a network of suppliers for composites and power electronics ensures component availability. These factors collectively enhance Canada’s significant capacity to expand its indirect drive turbine footprint.
To know more about the market opportunities by region and country, click here to
Buy The Complete Report
Growing Demand For Efficient Power
Integration With Smart Grid Systems
High Initial Capital Investment
Complex Regulatory Approval Processes
Request Free Customization of this report to help us to meet your business objectives.
The indirect drive turbine market is shaped by a blend of established OEMs such as Siemens and emerging regional players, intensifying competition around technology differentiation and cost efficiency. Companies are leveraging strategic partnerships to co‑develop advanced turbine platforms, while M&A activity consolidates expertise and expands geographic reach. Continuous innovation in blade design and digital control systems is a key driver that distinguishes market leaders and accelerates adoption across offshore and onshore projects.
Top Player’s Company Profile
Recent Developments
SkyQuest’s ABIRAW (Advanced Business Intelligence, Research & Analysis Wing) is our Business Information Services team that Collects, Collates, Correlates, and Analyses the Data collected by means of Primary Exploratory Research backed by robust Secondary Desk research. As per SkyQuest analysis, the market is propelled primarily by the growing demand for efficient power conversion, which pushes utilities and developers toward indirect‑drive turbines that reduce mechanical losses and lower operating costs. A second strong driver is the integration with smart‑grid systems that require precise speed control and real‑time monitoring, making these turbines attractive for flexible grid services. Europe leads the market, benefitting from strong policy support and an advanced offshore‑wind supply chain, while the power‑generation segment accounts for the largest share due to its need for high‑efficiency, reliable units. However, the high upfront capital outlay remains a notable restraint, slowing adoption in cost‑sensitive projects.
| Report Metric | Details |
|---|---|
| Market size value in 2024 | USD 528.4 Million |
| Market size value in 2033 | USD 862.86 Million |
| Growth Rate | 5.6% |
| Base year | 2024 |
| Forecast period | (2026-2033) |
| Forecast Unit (Value) | USD Million |
| Segments covered |
|
| Regions covered | North America (US, Canada), Europe (Germany, France, United Kingdom, Italy, Spain, Rest of Europe), Asia Pacific (China, India, Japan, Rest of Asia-Pacific), Latin America (Brazil, Rest of Latin America), Middle East & Africa (South Africa, GCC Countries, Rest of MEA) |
| Companies covered |
|
| Customization scope | Free report customization with purchase. Customization includes:-
|
To get a free trial access to our platform which is a one stop solution for all your data requirements for quicker decision making. This platform allows you to compare markets, competitors who are prominent in the market, and mega trends that are influencing the dynamics in the market. Also, get access to detailed SkyQuest exclusive matrix.
Table Of Content
Executive Summary
Market overview
Parent Market Analysis
Market overview
Market size
KEY MARKET INSIGHTS
COVID IMPACT
MARKET DYNAMICS & OUTLOOK
Market Size by Region
KEY COMPANY PROFILES
Methodology
For the Indirect Drive Turbine Market, our research methodology involved a mixture of primary and secondary data sources. Key steps involved in the research process are listed below:
1. Information Procurement: This stage involved the procurement of Market data or related information via primary and secondary sources. The various secondary sources used included various company websites, annual reports, trade databases, and paid databases such as Hoover's, Bloomberg Business, Factiva, and Avention. Our team did 45 primary interactions Globally which included several stakeholders such as manufacturers, customers, key opinion leaders, etc. Overall, information procurement was one of the most extensive stages in our research process.
2. Information Analysis: This step involved triangulation of data through bottom-up and top-down approaches to estimate and validate the total size and future estimate of the Indirect Drive Turbine Market.
3. Report Formulation: The final step entailed the placement of data points in appropriate Market spaces in an attempt to deduce viable conclusions.
4. Validation & Publishing: Validation is the most important step in the process. Validation & re-validation via an intricately designed process helped us finalize data points to be used for final calculations. The final Market estimates and forecasts were then aligned and sent to our panel of industry experts for validation of data. Once the validation was done the report was sent to our Quality Assurance team to ensure adherence to style guides, consistency & design.
Analyst Support
Customization Options
With the given market data, our dedicated team of analysts can offer you the following customization options are available for the Indirect Drive Turbine Market:
Product Analysis: Product matrix, which offers a detailed comparison of the product portfolio of companies.
Regional Analysis: Further analysis of the Indirect Drive Turbine Market for additional countries.
Competitive Analysis: Detailed analysis and profiling of additional Market players & comparative analysis of competitive products.
Go to Market Strategy: Find the high-growth channels to invest your marketing efforts and increase your customer base.
Innovation Mapping: Identify racial solutions and innovation, connected to deep ecosystems of innovators, start-ups, academics, and strategic partners.
Category Intelligence: Customized intelligence that is relevant to their supply Markets will enable them to make smarter sourcing decisions and improve their category management.
Public Company Transcript Analysis: To improve the investment performance by generating new alpha and making better-informed decisions.
Social Media Listening: To analyze the conversations and trends happening not just around your brand, but around your industry as a whole, and use those insights to make better Marketing decisions.
REQUEST FOR SAMPLE
 REQUEST FREE CUSTOMIZATION


Want to customize this report? This report can be personalized according to your needs. Our analysts and industry experts will work directly with you to understand your requirements and provide you with customized data in a short amount of time. We offer $1000 worth of FREE customization at the time of purchase.
Feedback From Our Clients


 USA (+1) 351-333-4748

