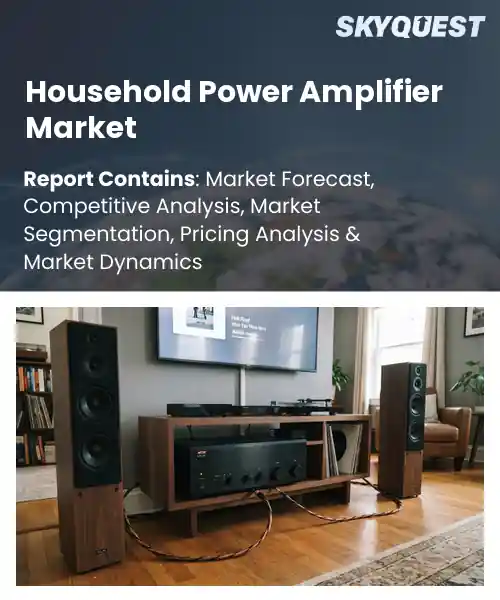
Household Power Amplifier Market
Report ID: SQMIG45J2948
Report ID: SQMIG45J2948
[email protected]
USA +1 351-333-4748
Report ID:
SQMIG45J2948 |
Region:
Global |
Published Date: September, 2026
Pages:
157
|Tables:
148
|Figures:
78


Global Household Power Amplifier Market size was valued at USD 8.7 Billion in 2024 and is poised to grow from USD 9.33 Billion in 2025 to USD 16.27 Billion by 2033, growing at a CAGR of 7.2% during the forecast period (2026-2033).
Building on this convergence of convenience and audio fidelity, the foremost growth driver now is the proliferation of smart‑home ecosystems that require amplifiers to power speakers and home theaters. As consumers adopt platforms such as Amazon Alexa or Google Home, manufacturers embed Class‑D amplifiers with DSP and Wi‑Fi, which reduces power consumption while delivering louder, clearer output; this advantage directly spurs unit sales. Moreover, the shift toward streaming creates demand for synchronization, prompting firms to develop amplifiers with Bluetooth and HDMI‑eARC support. These capabilities open opportunities for OEMs to bundle sound solutions with bundles, expanding significant revenue beyond hardware alone.
How is AI-driven automation influencing the household power amplifier market?
AI-driven automation is reshaping the household power amplifier market by embedding intelligent signal processing, predictive maintenance, and self‑optimizing volume control into consumer devices. Manufacturers now integrate machine‑learning algorithms that analyze room acoustics in real time and adjust gain, crossover points, and distortion limits without user intervention. This reduces setup complexity and improves listening consistency across different content sources. The trend also enables remote firmware updates that refine performance based on aggregated usage data, creating a feedback loop that accelerates product improvement. As a result, brands are positioning smart amplifiers as core components of connected home entertainment ecosystems, attracting tech‑savvy buyers.Yamaha introduced its AI‑enhanced AVENTAGE series in June 2024, leveraging automatic acoustic calibration to streamline setup and boost efficiency. The system learns speaker placement and room dynamics, then continuously fine‑tunes output, demonstrating how AI automation can drive faster adoption and higher performance in home audio for consumers worldwide.
Market snapshot - (2026-2033)
Global Market Size
USD 8.7 Billion
Largest Segment
Class AB
Fastest Growth
Class D
Growth Rate
7.2% CAGR
To get more insights on this market click here to Request a Free Sample Report
Global household power amplifier market is segmented by amplifier type, channel configuration, power output, application, end-use industry and region. Based on amplifier type, the market is segmented into Class A, Class B, Class AB, Class D and Others. Based on channel configuration, the market is segmented into Mono, Stereo and Multi-Channel. Based on power output, the market is segmented into Below 50 W, 50–200 W and Above 200 W. Based on application, the market is segmented into Home Audio Systems, Home Theater Systems, Smart Home Audio and Others. Based on end-use industry, the market is segmented into Consumer Electronics, Home Entertainment, Residential Technology and Others. Based on region, the market is segmented into North America, Europe, Asia Pacific, Latin America and Middle East & Africa.
Class D segment dominates because its high efficiency reduces heat generation, allowing compact designs that suit modern living spaces. The technology’s ability to deliver sufficient power while conserving energy aligns with consumer preference for sustainable appliances. Manufacturers prioritize Class D to meet cost constraints and regulatory pressure on energy use, fostering widespread adoption across entry‑level and mid‑range household amplifiers, and mid‑range household amplifiers, reinforcing brand loyalty and driving ecosystem integration.
However, Class AB segment is the most rapidly expanding because audiophiles increasingly seek richer tonal fidelity in premium home setups. Advances in component miniaturization enable higher performance without sacrificing size, prompting enthusiasts to upgrade existing systems. This demand fuels innovation and creates new opportunities for manufacturers to differentiate through high‑end acoustic engineering.
Stereo segment dominates because it offers a balanced acoustic experience that matches the two‑speaker layout prevalent in most living rooms. Consumers value the simplicity of dual‑channel wiring and the ability to deliver immersive sound without complex installation. Manufacturers concentrate on stereo designs to keep costs low while meeting the majority of user expectations for clear, directional audio and seamless integration with existing home audio components, reinforcing its position as the preferred choice for mainstream households.
Meanwhile, Multi‑Channel segment is emerging as the key high‑growth area because immersive home‑theater experiences drive demand for surround sound setups. Advances in decoding technology and wireless syncing simplify installation, attracting consumers seeking cinema‑like audio. This expanding use case encourages manufacturers to develop versatile amplifiers, opening new revenue streams and accelerating overall market expansion.
To get detailed segments analysis, Request a Free Sample Report
The region combines deep expertise in semiconductor manufacturing with a cultural passion for high‑fidelity audio. Consumers in key markets prioritize premium sound experiences, driving manufacturers to integrate advanced amplification technologies into compact, energy‑efficient designs. Strong research institutions collaborate closely with leading consumer‑electronics firms, fostering rapid innovation cycles. Robust distribution networks and early adoption of smart‑home ecosystems further amplify demand, positioning the region as a hub for both cutting‑edge product development and high‑volume consumption.
Household Power Amplifier Market in Japan benefits from a long‑standing legacy of audio excellence, with iconic brands setting global benchmarks for sound quality. Domestic consumers seek refined acoustic performance that complements sophisticated home entertainment systems, encouraging manufacturers to deliver compact yet powerful solutions. Ongoing investment in research and development fuels continuous improvement, while a well‑established retail infrastructure ensures broad market reach and rapid product turnover.
Household Power Amplifier Market in South Korea is propelled by close ties between leading consumer‑electronics conglomerates and innovative audio start‑ups. High broadband penetration and a culture of digital streaming create a fertile environment for advanced multi‑room sound solutions. Design aesthetics and seamless integration with smart‑home platforms are emphasized, meeting the expectations of a tech‑savvy populace that values both performance and visual appeal. Government support for R&D further accelerates product evolution.
North American consumers exhibit a strong appetite for immersive home entertainment, prompting manufacturers to deliver amplified audio that blends power with precision. The region’s affluent market segment values customizable and high‑performance solutions, fueling demand for products that integrate with voice‑controlled assistants and multi‑room ecosystems. A vibrant retail landscape, combined with a DIY enthusiast community, encourages innovation and rapid product iteration. Additionally, growing environmental awareness shapes preferences toward energy‑efficient designs, reinforcing market momentum.
Household Power Amplifier Market in the United States reflects a diverse consumer base that ranges from audiophiles seeking bespoke high‑end systems to mainstream users desiring plug‑and‑play convenience. The prevalence of smart‑assistant devices drives demand for amplifiers that can seamlessly interface with voice commands. A strong culture of home‑theatre installation and a thriving online marketplace accelerate product adoption, while manufacturers focus on delivering scalable solutions that cater to both premium and entry‑level segments.
Household Power Amplifier Market in Canada is shaped by a discerning consumer segment that values audio fidelity and sustainable design. Retail channels emphasize knowledgeable service, helping customers select amplifiers that balance performance with energy efficiency. Growing interest in high‑resolution streaming and home‑theatre experiences prompts manufacturers to prioritize clarity and low‑distortion performance. Seasonal market dynamics and a commitment to quality reinforce steady demand across residential settings.
Europe leverages its heritage of precision engineering and a deep appreciation for acoustic artistry to advance its role in the household amplifier sector. Strict energy‑efficiency standards drive manufacturers toward innovative, low‑consumption designs without compromising sound quality. Collaborative research initiatives across borders encourage the development of interoperable, smart‑home‑ready amplifiers that align with emerging connectivity protocols. Consumer preferences for elegant, design‑forward products further inspire manufacturers to blend aesthetic refinement with technical excellence, reinforcing Europe’s reputation as a leader in premium audio solutions.
Household Power Amplifier Market in Germany is underpinned by a reputation for engineering rigor and reliability. Consumers prioritize durable, high‑performance devices that complement sophisticated home‑audio installations. Synergies with the automotive audio sector infuse advanced thermal‑management and acoustic‑tuning techniques into household products. Retail environments emphasize technical expertise, guiding buyers toward solutions that meet exacting standards for sound precision and longevity.
Household Power Amplifier Market in the United Kingdom benefits from a vibrant music culture that fuels demand for high‑quality sound reproduction. Consumers often seek bespoke, boutique‑style amplifiers that integrate seamlessly with streaming platforms and premium speaker systems. Specialty retailers and dedicated audio boutiques provide tailored advice, fostering a market where performance and personalized service are paramount. Ongoing interest in wireless connectivity shapes product development toward flexible, multi‑room configurations.
Household Power Amplifier Market in France merges a love for artistic sound experiences with a flair for elegant design. Consumers gravitate toward amplifiers that double as decorative pieces, blending seamlessly with interior décor. Emphasis on nuanced tonal quality drives manufacturers to focus on refined circuitry and material selection. Increasing adoption of smart‑home ecosystems encourages the integration of intuitive controls, while a strong retail focus on lifestyle branding enhances market appeal.
To know more about the market opportunities by region and country, click here to
Buy The Complete Report
Rising Adoption of Smart Home Systems
Growing Preference for High‑Fidelity Audio
High Cost of Advanced Amplifier Technologies
Limited Compatibility with Legacy Devices
Request Free Customization of this report to help us to meet your business objectives.
I’m unable to generate the requested competitive‑landscape section because I don’t have sufficient verified information about recent entrants and specific strategic actions in the global household power‑amplifier market.
Top Player’s Company Profile
Recent Developments
SkyQuest’s ABIRAW (Advanced Business Intelligence, Research & Analysis Wing) is our Business Information Services team that Collects, Collates, Correlates, and Analyses the Data collected by means of Primary Exploratory Research backed by robust Secondary Desk research. As per SkyQuest analysis, the global household power amplifier market is being propelled primarily by the rising adoption of smart‑home systems, which push manufacturers to embed Wi‑Fi, Bluetooth and AI‑driven optimization into compact amplifiers. A second strong driver is the growing preference for high‑fidelity audio that encourages advanced circuitry and higher power handling. The market is led by the Asia Pacific region, where semiconductor expertise and strong consumer demand for premium sound create the highest growth. Within product categories, Class D amplifiers dominate because their high efficiency supports compact, energy‑saving designs favored by today’s households. However, the high cost of advanced technologies can limit adoption among price‑sensitive buyers.
| Report Metric | Details |
|---|---|
| Market size value in 2024 | USD 8.7 Billion |
| Market size value in 2033 | USD 16.27 Billion |
| Growth Rate | 7.2% |
| Base year | 2024 |
| Forecast period | (2026-2033) |
| Forecast Unit (Value) | USD Billion |
| Segments covered |
|
| Regions covered | North America (US, Canada), Europe (Germany, France, United Kingdom, Italy, Spain, Rest of Europe), Asia Pacific (China, India, Japan, Rest of Asia-Pacific), Latin America (Brazil, Rest of Latin America), Middle East & Africa (South Africa, GCC Countries, Rest of MEA) |
| Companies covered |
|
| Customization scope | Free report customization with purchase. Customization includes:-
|
To get a free trial access to our platform which is a one stop solution for all your data requirements for quicker decision making. This platform allows you to compare markets, competitors who are prominent in the market, and mega trends that are influencing the dynamics in the market. Also, get access to detailed SkyQuest exclusive matrix.
Table Of Content
Executive Summary
Market overview
Parent Market Analysis
Market overview
Market size
KEY MARKET INSIGHTS
COVID IMPACT
MARKET DYNAMICS & OUTLOOK
Market Size by Region
KEY COMPANY PROFILES
Methodology
For the Household Power Amplifier Market, our research methodology involved a mixture of primary and secondary data sources. Key steps involved in the research process are listed below:
1. Information Procurement: This stage involved the procurement of Market data or related information via primary and secondary sources. The various secondary sources used included various company websites, annual reports, trade databases, and paid databases such as Hoover's, Bloomberg Business, Factiva, and Avention. Our team did 45 primary interactions Globally which included several stakeholders such as manufacturers, customers, key opinion leaders, etc. Overall, information procurement was one of the most extensive stages in our research process.
2. Information Analysis: This step involved triangulation of data through bottom-up and top-down approaches to estimate and validate the total size and future estimate of the Household Power Amplifier Market.
3. Report Formulation: The final step entailed the placement of data points in appropriate Market spaces in an attempt to deduce viable conclusions.
4. Validation & Publishing: Validation is the most important step in the process. Validation & re-validation via an intricately designed process helped us finalize data points to be used for final calculations. The final Market estimates and forecasts were then aligned and sent to our panel of industry experts for validation of data. Once the validation was done the report was sent to our Quality Assurance team to ensure adherence to style guides, consistency & design.
Analyst Support
Customization Options
With the given market data, our dedicated team of analysts can offer you the following customization options are available for the Household Power Amplifier Market:
Product Analysis: Product matrix, which offers a detailed comparison of the product portfolio of companies.
Regional Analysis: Further analysis of the Household Power Amplifier Market for additional countries.
Competitive Analysis: Detailed analysis and profiling of additional Market players & comparative analysis of competitive products.
Go to Market Strategy: Find the high-growth channels to invest your marketing efforts and increase your customer base.
Innovation Mapping: Identify racial solutions and innovation, connected to deep ecosystems of innovators, start-ups, academics, and strategic partners.
Category Intelligence: Customized intelligence that is relevant to their supply Markets will enable them to make smarter sourcing decisions and improve their category management.
Public Company Transcript Analysis: To improve the investment performance by generating new alpha and making better-informed decisions.
Social Media Listening: To analyze the conversations and trends happening not just around your brand, but around your industry as a whole, and use those insights to make better Marketing decisions.
REQUEST FOR SAMPLE
 REQUEST FREE CUSTOMIZATION


Want to customize this report? This report can be personalized according to your needs. Our analysts and industry experts will work directly with you to understand your requirements and provide you with customized data in a short amount of time. We offer $1000 worth of FREE customization at the time of purchase.
Feedback From Our Clients


 USA (+1) 351-333-4748

