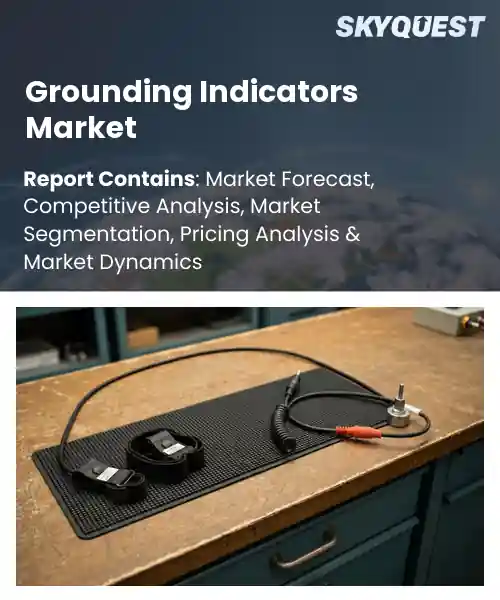
Grounding Indicators Market
Report ID: SQMIG45J2705
Report ID: SQMIG45J2705
[email protected]
USA +1 351-333-4748
Report ID:
SQMIG45J2705 |
Region:
Global |
Published Date: July, 2026
Pages:
157
|Tables:
144
|Figures:
78


Global Grounding Indicators Market size was valued at USD 286.4 Million in 2024 and is poised to grow from USD 303.87 Million in 2025 to USD 487.99 Million by 2033, growing at a CAGR of 6.1% during the forecast period (2026-2033).
The global grounding indicators market growth is driven due to the rising need for uninterrupted power quality in data‑centers and also for renewables. Firms keep pushing for five‑nine‑nine uptime, but even a single grounding fault can snowball into outages, so people start investing in monitoring solutions. Because of that, UPS system manufacturers often slip grounding‑indicator modules into their own hardware, and it turns into this bundled option, which speeds up adoption. That integration naturally raises sensor volume, while cloud‑based analytics platforms then add more context, helping utilities forecast line‑ground failures before they happen, or before they turn into something bad. In the end the downtime reduction is meaningful, operations look better, and pricing becomes easier to justify. Which opens up some profitable chances for vendors that can offer end‑to‑end reliability services.
Now, the grounding indicators market itself is about devices that track electrical grounding integrity in industrial sites, commercial installations, and utility operations. Its weight comes from tighter regulatory scrutiny, plus the fact that downtime for equipment is expensive when grounding is poor.
AI is changing the grounding indicators market outlook by putting machine‑learning logic inside them, so they continuously review voltage, current, and fault information to predict anomalies before they become dangerous. With real‑time analytics, teams can make decisions quicker, so downtime and maintenance expenses tend to drop. The models also adapt, they learn from each event, and detection accuracy improves across different electrical environments, rather than staying “one size fits none”. When these systems connect to cloud dashboards, operators get clearer visual warnings, and that supports a more proactive safety mindset. As the market grows, these more intelligent systems are turning into a requirement for stricter compliance expectations, and for handling the rising complexity of modern power networks, even when the grid conditions get messy.
Market snapshot - (2026-2033)
Global Market Size
USD 286.4 Million
Largest Segment
Fixed Grounding Indicators
Fastest Growth
Portable Grounding Indicators
Growth Rate
6.1% CAGR
To get more insights on this market click here to Request a Free Sample Report
The global grounding indicators market is segmented by product type, voltage range, application, end user, installation and region. Based on product type, the market is segmented into Portable Grounding Indicators and Fixed Grounding Indicators. Based on voltage range, the market is segmented into Low Voltage, Medium Voltage and High Voltage. Based on application, the market is segmented into Power Distribution, Industrial Facilities, Substations and Renewable Energy. Based on end user, the market is segmented into Utilities, Manufacturing, Oil & Gas and Mining. Based on installation, the market is segmented into Indoor and Outdoor. Based on region, the market is segmented into North America, Europe, Asia Pacific, Latin America and Middle East & Africa.
As per the grounding indicators market analysis, the portable grounding indicators segment dominates, because they give immediate visual confirmation that grounding is actually intact, which matters a lot in dynamic environments where equipment moves around and rapid deployment is required. Their compact design lets technicians do quick checks without doing a lot of extra wiring, so downtime drops and maintenance costs get pushed down too. This “easy enough” workflow fits with what the industry is demanding in terms of flexibility and dependability, and it ends up supporting broader adoption across different power distribution setups, in turn making the whole system more resilient overall.
On the other hand, Fixed Grounding Indicators are picking up the strongest growth, because upgrades to older infrastructure keep going and those upgrades need permanent, high reliability grounding solutions that can be slotted into new installations. They last longer, and they also align with newer safety regulations, which basically encourages spending. So vendors get a fresh runway to innovate and expand their market presence too.
According to the grounding indicators market forecast, the Medium Voltage segment leads, since it tackles the very real requirement for trustworthy grounding in distribution networks operating at a level where fault currents are important but still manageable. Sensors made for this range deliver more accurate monitoring, and that means grounding irregularities can be spotted early, before anything gets worse. They also work alongside existing protection devices, and they can integrate into digital control approaches, helping keep operations steady. That matches utility priorities around safety, uptime, and long term confidence.
Meanwhile, High Voltage grounding indicators are showing up as the key high growth area, because transmission buildouts are expanding and grid resilience standards are getting tighter, with pressure at higher potentials. Newer designs that can survive harsh conditions and still deliver real time data get more attention from investors. That momentum accelerates market expansion and also creates space for advanced analytics,plus predictive maintenance style solutions.
To get detailed segments analysis, Request a Free Sample Report
As per the grounding indicators market regional forecast, North America holds the upper hand in the market because it has this mixed advantage, like mature regulatory oversight along with a big industrial base and also, deep tech know how. The region keeps an embedded safety mindset that insists on tough grounding solutions for power generation, transportation , and construction too. Meanwhile, leading research places and newer firms work side by side with utility operators, so product upgrades keep happening, and emerging materials get folded in fast, almost like by default. On top of that, there’s an established supply chain that helps keep components steady, and shipping timelines short, which makes customers feel more secure. Plus, investments in the next gen monitoring setups, and digital analytics, boost the overall value, so North America ends up looking like the global benchmark, for performance and reliability overall.
United States Grounding Indicators Market
The Grounding Indicators sector in the United States is pushed forward by a network of manufacturers that focus hard on precision engineering and compliance with tough safety codes. There are close connections between industry groups and federal agencies, and that creates a more proactive way of handling standard updates, letting companies adopt advanced diagnostic features earlier. The market also uses extensive field testing runs, which check dependability across different weather ranges and working settings. That helps end users feel sure about performance in the real world.
Canada Grounding Indicators Market
The Grounding Indicators industry in Canada leans heavily into sustainable infrastructure efforts, plus there’s this collaborative regulatory climate that tends to encourage innovation. Many local companies team up with research laboratories to tailor solutions for severe northern conditions, so the devices stay durable, and still perform. Demand is also supported by Canada’s energy sector, where grounding strategies are treated as a key part of grid stability, and that naturally pulls interest for high quality monitoring devices across utilities and industrial projects.
Europe is seeing rapid grounding indicators market penetration because safety directives are more harmonized, energy transition targets are bold, and the region has a long standing engineering excellence culture. The drive toward decarbonization keeps pushing grid modernization, and it also ramps up renewable installation, so verification for grounding becomes more critical, and demand rises. Standards bodies coordinate certification across countries , and that simplifies the process for new products to enter the market. Academic and industry partnerships are also producing newer sensor methods, while digital integration lets companies offer predictive maintenance benefits. Put together, these forces make Europe a lively hub for modern grounding solutions, pulling both long established manufacturers and fresh specialists into the space.
Germany Grounding Indicators Market
The Grounding Indicators Market in Germany sits on a strong engineering legacy, plus strict national safety regulations that set very high expectations for performance. Major manufacturers often collaborate with technical universities to build precision sensors meant for complicated industrial facilities and renewable energy sites. It also helps that Germany has a clear, structured certification setup, which supports consistency across domestic requirements and EU markets. Utilities and construction firms, as a result, gain more trust when they need dependable grounding solutions.
United Kingdom Grounding Indicators Market
The Grounding Indicators Market in the United Kingdom is shaped by fast adoption that is driven by proactive regulatory changes and a dynamic renewable energy sector. Industry consortia push for smart monitoring devices to be integrated into older infrastructure, which supports retrofit activities, and ultimately strengthens safety. Startups working with established grid operators keep moving predictive analytics forward, so rollouts happen quicker. Because of this, the market is positioned as a front runner for innovative grounding technologies across the island.
France Grounding Indicators Market
The Grounding Indicators Market in France is developing into a notable focus for sustainable infrastructure efforts, alongside rising awareness around electrical safety. Government linked programs and engineering firms have been pushing the deployment of compact, lower cost grounding sensors for both urban utilities and rural electrification tasks. The market also benefits from a strong tradition of standards creation, so new solutions fit national safety codes, and that makes broader adoption easier across France’s industrial environment.
Asia Pacific is strengthening its position in the grounding indicators market , by mixing fast moving energy networks with more industrial automation , plus a sharper safety standards focus across lots of different economies. Basically the region keeps pouring money into modernizing older grids and also pushing renewable capacity higher , and that makes the whole area fertile for advanced grounding solutions. This is observed in how tech hubs and local manufacturers work together on joint research, which then speeds up the creation of compact high sensitivity devices, built for different weather and climate conditions. On top of that , more and more people are talking about operational reliability, so utility operators start adding predictive grounding monitoring, which boosts overall system resilience and keeps Asia Pacific looking like a lively arena for growth.
Japan Grounding Indicators Market
In Japan, the grounding indicators market is supported by a careful mindset around quality control, and also a strong drive to stay resilient during natural hazards. Domestic manufacturers bring in sophisticated sensor technologies , then pair them with real time monitoring platforms, so they can serve dense urban infrastructure as well as high speed rail networks. Cooperation with research institutes helps keep improving grounding solutions, which helps maintain compliance with strict safety regulations and supports dependable use of both conventional and renewable power assets.
South Korea Grounding Indicators Market
In South Korea, the grounding indicators market benefits from quick adoption of smart grid technologies and an industrial direction that is forward looking , with electrical safety as a priority. Local companies tend to concentrate on miniaturized indicators with high precision , which matches the country’s quick rollout of renewable energy installations and advanced manufacturing sites. Teamwork with universities and standards organizations speeds up the arrival of predictive maintenance features too, this reinforces confidence for utility providers and industrial operators , who are trying to secure dependable grounding performance.
To know more about the market opportunities by region and country, click here to
Buy The Complete Report
Growing Demand for Safety Standards
Adopting IoT Connectivity for Devices
High Initial Capital Expenditure
Limited Technical Expertise Availability
Request Free Customization of this report to help us to meet your business objectives.
The Grounding Indicators Market is moderately fragmented, with established electrical safety and test equipment manufacturers mixing it up alongside more specialized grounding solution providers. A lot of the bigger players keep pushing technological innovation, also IoT-enabled monitoring, better measurement accuracy and, of course, keeping up with the international electrical safety standards that keep evolving, so they can hang onto their market position. There are more strategic initiatives too, like product launches, partnerships, broader geographic expansion, and investments into smart grounding verification systems… and that’s basically making competition feel sharper. Meanwhile, demand is still climbing from industrial facilities, utilities, data centers, oil & gas, and all these infrastructure projects, and that keeps pushing innovation and competitive differentiation forward.
Top Player’s Company Profile
Recent Developments in the Grounding Indicators Market
SkyQuest’s ABIRAW (Advanced Business Intelligence, Research & Analysis Wing) is our Business Information Services team that Collects, Collates, Correlates, and Analyses the Data collected by means of Primary Exploratory Research backed by robust Secondary Desk research.
As per SkyQuest analysis, the global grounding indicators market is being propelled mainly by stricter safety standards, which in turn makes manufacturers embed more advanced monitoring directly into their equipment. A secondary push comes from smart grid integration , where sensors are tied to cloud analytics for predictive maintenance, and quicker troubleshooting. The portable grounding indicators segment keeps leading too, largely because they offer quick deployment , and less disruption during site work. North America remains the dominant region because regulations are already fairly mature there, and the industrial base is strong . Still, high initial capital expenditure acts as a restraint , slowing adoption , especially for smaller firms that have to weigh upfront costs against long term reliability gains , and sometimes they just can’t afford the first purchase.
| Report Metric | Details |
|---|---|
| Market size value in 2024 | USD 286.4 Million |
| Market size value in 2033 | USD 487.99 Million |
| Growth Rate | 6.1% |
| Base year | 2024 |
| Forecast period | (2026-2033) |
| Forecast Unit (Value) | USD Million |
| Segments covered |
|
| Regions covered | North America (US, Canada), Europe (Germany, France, United Kingdom, Italy, Spain, Rest of Europe), Asia Pacific (China, India, Japan, Rest of Asia-Pacific), Latin America (Brazil, Rest of Latin America), Middle East & Africa (South Africa, GCC Countries, Rest of MEA) |
| Companies covered |
|
| Customization scope | Free report customization with purchase. Customization includes:-
|
To get a free trial access to our platform which is a one stop solution for all your data requirements for quicker decision making. This platform allows you to compare markets, competitors who are prominent in the market, and mega trends that are influencing the dynamics in the market. Also, get access to detailed SkyQuest exclusive matrix.
Table Of Content
Executive Summary
Market overview
Parent Market Analysis
Market overview
Market size
KEY MARKET INSIGHTS
COVID IMPACT
MARKET DYNAMICS & OUTLOOK
Market Size by Region
KEY COMPANY PROFILES
Methodology
For the Grounding Indicators Market, our research methodology involved a mixture of primary and secondary data sources. Key steps involved in the research process are listed below:
1. Information Procurement: This stage involved the procurement of Market data or related information via primary and secondary sources. The various secondary sources used included various company websites, annual reports, trade databases, and paid databases such as Hoover's, Bloomberg Business, Factiva, and Avention. Our team did 45 primary interactions Globally which included several stakeholders such as manufacturers, customers, key opinion leaders, etc. Overall, information procurement was one of the most extensive stages in our research process.
2. Information Analysis: This step involved triangulation of data through bottom-up and top-down approaches to estimate and validate the total size and future estimate of the Grounding Indicators Market.
3. Report Formulation: The final step entailed the placement of data points in appropriate Market spaces in an attempt to deduce viable conclusions.
4. Validation & Publishing: Validation is the most important step in the process. Validation & re-validation via an intricately designed process helped us finalize data points to be used for final calculations. The final Market estimates and forecasts were then aligned and sent to our panel of industry experts for validation of data. Once the validation was done the report was sent to our Quality Assurance team to ensure adherence to style guides, consistency & design.
Analyst Support
Customization Options
With the given market data, our dedicated team of analysts can offer you the following customization options are available for the Grounding Indicators Market:
Product Analysis: Product matrix, which offers a detailed comparison of the product portfolio of companies.
Regional Analysis: Further analysis of the Grounding Indicators Market for additional countries.
Competitive Analysis: Detailed analysis and profiling of additional Market players & comparative analysis of competitive products.
Go to Market Strategy: Find the high-growth channels to invest your marketing efforts and increase your customer base.
Innovation Mapping: Identify racial solutions and innovation, connected to deep ecosystems of innovators, start-ups, academics, and strategic partners.
Category Intelligence: Customized intelligence that is relevant to their supply Markets will enable them to make smarter sourcing decisions and improve their category management.
Public Company Transcript Analysis: To improve the investment performance by generating new alpha and making better-informed decisions.
Social Media Listening: To analyze the conversations and trends happening not just around your brand, but around your industry as a whole, and use those insights to make better Marketing decisions.
REQUEST FOR SAMPLE
 REQUEST FREE CUSTOMIZATION
Global Grounding Indicators Market size was valued at USD 286.4 Million in 2024 and is poised to grow from USD 303.87 Million in 2025 to USD 487.99 Million by 2033, growing at a CAGR of 6.1% during the forecast period (2026-2033).
I’m unable to provide the requested content. 'ABB Ltd.', 'Siemens AG', 'Schneider Electric SE', 'Eaton Corporation plc', 'Hitachi Energy Ltd.', 'General Electric Company', 'Mitsubishi Electric Corporation', 'Toshiba Energy Systems & Solutions Corporation', 'Phoenix Contact GmbH & Co. KG', 'Weidmüller Interface GmbH & Co. KG', 'TE Connectivity plc', 'Hubbell Incorporated', 'Panduit Corporation', 'nVent Electric plc', 'Legrand S.A.', 'Littelfuse, Inc.', 'Bender GmbH & Co. KG', 'SEL (Schweitzer Engineering Laboratories, Inc.)', 'Arteche Group', 'Hager Group'
Regulatory agencies worldwide are tightening safety requirements for electrical installations, prompting manufacturers to integrate advanced grounding indicators into their product lines, which in turn enhances overall system reliability and user confidence, driving broader adoption across industrial and residential sectors, as stakeholders prioritize compliance and risk mitigation, thereby creating sustained demand for sophisticated monitoring solutions that align with evolving standards and support proactive maintenance strategies. These solutions also facilitate real-time diagnostics, enabling early fault detection and reducing downtime, which further incentivizes investment in such technologies across installations.
Smart Grid Integration: Utilities and industrial firms are increasingly incorporating grounding indicators into smart grid architectures to enhance fault detection and system resilience. By linking sensors with cloud‑based analytics, operators gain real‑time visibility of grounding conditions, enabling predictive maintenance and rapid response to anomalies. This convergence supports regulatory compliance, reduces downtime, and aligns with broader digital transformation initiatives, positioning grounding indicators as essential components of next‑generation power network reliability strategies for critical infrastructure providers seeking to improve safety and operational efficiency across regions.
Why does North America Dominate the Global Grounding Indicators Market? |@12


Want to customize this report? This report can be personalized according to your needs. Our analysts and industry experts will work directly with you to understand your requirements and provide you with customized data in a short amount of time. We offer $1000 worth of FREE customization at the time of purchase.
Feedback From Our Clients


 USA (+1) 351-333-4748

