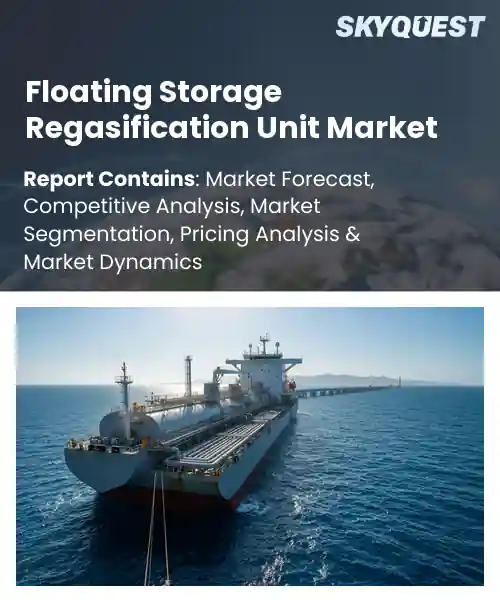
Floating Storage Regasification Unit Market
Report ID: SQMIG10D2065
Report ID: SQMIG10D2065
[email protected]
USA +1 351-333-4748
Report ID:
SQMIG10D2065 |
Region:
Global |
Published Date: June, 2026
Pages:
157
|Tables:
197
|Figures:
80


Global Floating Storage Regasification Unit Market size was valued at USD 7.9 Billion in 2024 and is poised to grow from USD 8.41 Billion in 2025 to USD 13.92 Billion by 2033, growing at a CAGR of 6.5% during the forecast period (2026-2033).
The primary driver of the floating storage regasification unit market is the accelerating demand for natural gas in regions lacking on‑shore import terminals. An FSRU combines an LNG carrier with onboard regasification equipment, allowing countries to receive, store, and convert LNG into pipeline gas without permanent infrastructure.
A second decisive factor shaping the market is the convergence of regulatory incentives and the declining cost of LNG cargoes, which together accelerate fleet expansion. When governments streamline permitting for berths and grant tax relief, operators can deploy vessels within months, translating support into capacity gains. Simultaneously, the drop in LNG spot prices lowers the breakeven threshold for regasification projects, prompting shippers to favor FSRUs over on‑shore plants. This dynamic is evident in Vietnam’s charter of two FSRUs to meet power‑generation needs, and in Europe’s adoption of units to replace aging pipelines, unlocking revenue streams while reinforcing security.
How are AI and IoT optimizing performance and cost efficiency in the Floating Storage Regasification Unit market?
AI and IoT are reshaping FSRU operations by delivering real time visibility, predictive analytics and automated control. Sensors monitor temperature, pressure and cargo flow, feeding data into machine learning models that forecast regasification demand and flag equipment wear before failure. Digital twins simulate vessel performance, allowing operators to fine tune power usage and reduce fuel consumption. Integrated platforms consolidate navigation, safety and maintenance alerts, cutting crew workload and enabling faster decision making. As the market expands, these technologies help meet tighter emission standards while keeping charter costs competitive, making floating units more attractive to gas importers.
Market snapshot - (2026-2033)
Global Market Size
USD 7.9 Billion
Largest Segment
Floating Storage Regasification Unit (FSRU) Vessel
Fastest Growth
Floating Storage Unit (FSU) with Regasification Facility
Growth Rate
6.5% CAGR
To get more insights on this market click here to Request a Free Sample Report
Global floating storage regasification unit market is segmented by type, construction type, storage capacity, regasification capacity, mooring system, application, end user and region. Based on type, the market is segmented into Floating Storage Regasification Unit (FSRU) Vessel and Floating Storage Unit (FSU) with Regasification Facility. Based on construction type, the market is segmented into Newbuild FSRU and Converted FSRU. Based on storage capacity, the market is segmented into Small Capacity FSRU, Medium Capacity FSRU and Large Capacity FSRU. Based on regasification capacity, the market is segmented into Low Regasification Capacity, Medium Regasification Capacity and High Regasification Capacity. Based on mooring system, the market is segmented into Jetty-Moored FSRU and Offshore-Moored FSRU. Based on application, the market is segmented into Power Generation, Industrial Gas Supply, National Gas Grid Supply and LNG Import Terminal Replacement/Supplementation. Based on end user, the market is segmented into Utilities & Power Companies, Oil & Gas Companies, LNG Importers & Traders and Government & State-Owned Energy Companies. Based on region, the market is segmented into North America, Europe, Asia Pacific, Latin America and Middle East & Africa.
Newbuild FSRU segment dominates with large floating storage regasification unit market share because it delivers integrated design that aligns vessel hull and regasification plant from inception, ensuring optimal space utilization and system efficiency. This synergy reduces installation time and operational risk, attracting investors seeking reliable turnkey solutions. The ability to incorporate the latest cryogenic technology enhances performance and compliance, which reinforces its appeal to stakeholders aiming for long term asset value and operational resilience in the floating storage regasification unit market.
As per floating storage regasification unit market outlook, converted FSRU segment sees the fastest growth because shipowners can repurpose existing carriers at lower capital outlay, accelerating fleet expansion. Emerging demand for rapid deployment and cost effective solutions drives conversions, while advances in modular regasification kits simplify retrofits, unlocking new opportunities and widening market participation.
As per floating storage regasification unit market analysis, offshore moored FSRU segment dominates because situating vessels away from congested ports permits flexible siting and reduces shoreline infrastructure constraints. This freedom enables operators to serve dispersed demand points and to bypass lengthy permitting processes, enhancing project speed. The offshore configuration also improves safety margins by distancing the regasification operation from populated areas, which aligns with regulatory preferences and strengthens investor confidence in deploying floating storage regasification solutions.
As per floating storage regasification unit market forecast, jetty moored FSRU segment experiences the strongest growth because ports upgrade jetty facilities to host larger vessels, cutting connection costs and easing logistics. Close proximity to onshore pipelines speeds gas delivery, drawing utilities that need rapid integration. Ongoing infrastructure investment and faster commissioning boost adoption, making this configuration a high growth path in the market.
To get detailed segments analysis, Request a Free Sample Report
As per floating storage regasification unit market regional outlook, the region benefits from an unprecedented convergence of maritime expertise, strategic coastal infrastructure, and a sustained appetite for liquefied natural gas as a bridge to cleaner energy mixes. Leading shipyards deliver high‑specification vessels with efficiency‑focused designs, while forward‑looking regulatory frameworks encourage investment in floating storage solutions. Proximity to major LNG import corridors and dense industrial hubs amplifies the economic rationale for on‑board regasification, reducing reliance on onshore facilities. Collaborative industry clusters foster innovation in cryogenic containment and propulsion, reinforcing the region’s reputation as a hub for advanced floating technologies. These strengths collectively cement Asia Pacific’s leading position in the global market.
As per floating storage regasification unit market regional forecast, Japan is shaped by a mature energy landscape that prioritizes flexibility and resilience. Advanced maritime engineering capabilities enable the rapid adaptation of vessels to evolving demand patterns, while established port logistics support seamless integration with domestic distribution networks. Strategic emphasis on reducing carbon intensity drives interest in floating solutions that complement offshore gas supply chains, fostering a synergistic environment for technology refinement and operational excellence.
As per floating storage regasification unit industry analysis, South Korea leverages a world‑class shipbuilding sector renowned for delivering high‑performance vessels at competitive scales. Government incentives encourage the deployment of floating infrastructure as part of broader energy diversification strategies, aligning with national goals for secure and cleaner power sources. The nation’s deepwater ports and well‑developed supply chain infrastructure provide an advantageous platform for efficient regasification operations, positioning South Korea as a dynamic contributor to regional energy flexibility.
Europe’s advancement is propelled by a decisive shift toward diversified energy imports and a commitment to decarbonization that elevates the appeal of flexible, low‑emission solutions. Liberalized market structures encourage private investment in floating assets, while stringent environmental regulations stimulate the adoption of technologies that minimize onshore footprint and emissions. Strong maritime heritage across key coastal nations supports the development of specialized vessels, and integrated cross‑border gas networks facilitate seamless distribution. Collaborative research initiatives enhance cryogenic safety and efficiency, reinforcing Europe’s strategic positioning as a hub for innovative floating regasification.
Germany is characterized by a robust engineering ecosystem that emphasizes precision and reliability. The country’s extensive pipeline grid and major inland terminals enable efficient transfer from floating units to downstream users, supporting a balanced energy mix. Policy frameworks that prioritize energy security and emission reductions drive interest in adaptable storage solutions, fostering a climate of continuous improvement in vessel technology and operational standards.
United Kingdom benefits from a long maritime tradition and strategic access to the North Sea gas corridor. Regulatory encouragement of flexible import options aligns with national objectives for resilient supply chains, while mature port facilities accommodate a range of vessel sizes. The emphasis on innovation in offshore engineering strengthens the UK’s role as a leading environment for deploying advanced floating regasification assets.
France is emerging amid a strong commitment to diversified energy sources and reduced carbon footprints. Coastal terminals equipped for rapid turnaround complement the nation’s push toward modular energy infrastructure. Collaborative projects between research institutes and shipbuilders foster the development of next‑generation floating solutions that align with France’s broader sustainability agenda, positioning the market for steady growth.
North America advances through a combination of expansive coastlines, deepwater ports, and a forward‑leaning energy policy environment that favors flexible import mechanisms. The region’s extensive natural gas pipeline network provides a ready conduit for regasified fuel, while private sector dynamism fuels investment in high‑capacity floating assets. Emphasis on operational safety, coupled with technological partnerships across the continent, drives continuous enhancement of vessel performance and environmental compliance. These factors collectively reinforce North America’s stature as a pivotal arena for floating storage regasification expansion.
United States leverages vast maritime infrastructure and a strong culture of private enterprise to accelerate adoption. Strategic ports along both Atlantic and Pacific coasts serve as gateways for floating units, integrating seamlessly with the nation’s extensive domestic gas distribution framework. Policy incentives aimed at energy diversification encourage market participants to invest in flexible, mobile regasification solutions, reinforcing the United States’ leadership in the sector.
Canada is shaped by its extensive shoreline and proximity to major Atlantic and Pacific trade routes. Collaborative initiatives between governmental agencies and industry stakeholders promote the utilization of floating platforms to enhance supply flexibility, especially in remote and northern regions. Emphasis on low‑impact infrastructure aligns with Canada’s environmental objectives, fostering a supportive environment for the growth of floating storage regasification capabilities
To know more about the market opportunities by region and country, click here to
Buy The Complete Report
Increasing LNG Demand From Industry
Strategic Port Infrastructure Expansion
Regulatory Approval Delays
High Capital Investment Required
Request Free Customization of this report to help us to meet your business objectives.
The floating storage regasification unit industry is intensifying as major operators pursue technology upgrades and strategic alliances to capture rising demand for flexible gas supply. Recent improvements in regasification efficiency and joint ventures announced at the FLNG & FSRU Congress 2025 illustrate how firms are leveraging innovation and partnerships to differentiate their fleets and expand service offerings.
SkyQuest’s ABIRAW (Advanced Business Intelligence, Research & Analysis Wing) is our Business Information Services team that Collects, Collates, Correlates, and Analyses the Data collected by means of Primary Exploratory Research backed by robust Secondary Desk research.
As per SkyQuest analysis, the floating storage regasification unit market growth is chiefly driven by the rising demand for natural gas in regions without on‑shore import terminals which pushes utilities toward flexible FSRU solutions; a secondary catalyst is the strategic expansion of deep‑water ports and jetty facilities that streamline logistics and lower supply‑chain costs. The dominant region is Asia Pacific, where strong shipbuilding capacity and dense industrial demand sustain growth, while the newbuild FSRU segment leads the market by offering integrated designs that optimize space and performance. However, progress can be hampered by regulatory approval delays that extend permitting timelines and increase financial uncertainty for investors.
| Report Metric | Details |
|---|---|
| Market size value in 2024 | USD 7.9 Billion |
| Market size value in 2033 | USD 13.92 Billion |
| Growth Rate | 6.5% |
| Base year | 2024 |
| Forecast period | (2026-2033) |
| Forecast Unit (Value) | USD Billion |
| Segments covered |
|
| Regions covered | North America (US, Canada), Europe (Germany, France, United Kingdom, Italy, Spain, Rest of Europe), Asia Pacific (China, India, Japan, Rest of Asia-Pacific), Latin America (Brazil, Rest of Latin America), Middle East & Africa (South Africa, GCC Countries, Rest of MEA) |
| Companies covered |
|
| Customization scope | Free report customization with purchase. Customization includes:-
|
To get a free trial access to our platform which is a one stop solution for all your data requirements for quicker decision making. This platform allows you to compare markets, competitors who are prominent in the market, and mega trends that are influencing the dynamics in the market. Also, get access to detailed SkyQuest exclusive matrix.
Table Of Content
Executive Summary
Market overview
Parent Market Analysis
Market overview
Market size
KEY MARKET INSIGHTS
COVID IMPACT
MARKET DYNAMICS & OUTLOOK
Market Size by Region
KEY COMPANY PROFILES
Methodology
For the Floating Storage Regasification Unit Market, our research methodology involved a mixture of primary and secondary data sources. Key steps involved in the research process are listed below:
1. Information Procurement: This stage involved the procurement of Market data or related information via primary and secondary sources. The various secondary sources used included various company websites, annual reports, trade databases, and paid databases such as Hoover's, Bloomberg Business, Factiva, and Avention. Our team did 45 primary interactions Globally which included several stakeholders such as manufacturers, customers, key opinion leaders, etc. Overall, information procurement was one of the most extensive stages in our research process.
2. Information Analysis: This step involved triangulation of data through bottom-up and top-down approaches to estimate and validate the total size and future estimate of the Floating Storage Regasification Unit Market.
3. Report Formulation: The final step entailed the placement of data points in appropriate Market spaces in an attempt to deduce viable conclusions.
4. Validation & Publishing: Validation is the most important step in the process. Validation & re-validation via an intricately designed process helped us finalize data points to be used for final calculations. The final Market estimates and forecasts were then aligned and sent to our panel of industry experts for validation of data. Once the validation was done the report was sent to our Quality Assurance team to ensure adherence to style guides, consistency & design.
Analyst Support
Customization Options
With the given market data, our dedicated team of analysts can offer you the following customization options are available for the Floating Storage Regasification Unit Market:
Product Analysis: Product matrix, which offers a detailed comparison of the product portfolio of companies.
Regional Analysis: Further analysis of the Floating Storage Regasification Unit Market for additional countries.
Competitive Analysis: Detailed analysis and profiling of additional Market players & comparative analysis of competitive products.
Go to Market Strategy: Find the high-growth channels to invest your marketing efforts and increase your customer base.
Innovation Mapping: Identify racial solutions and innovation, connected to deep ecosystems of innovators, start-ups, academics, and strategic partners.
Category Intelligence: Customized intelligence that is relevant to their supply Markets will enable them to make smarter sourcing decisions and improve their category management.
Public Company Transcript Analysis: To improve the investment performance by generating new alpha and making better-informed decisions.
Social Media Listening: To analyze the conversations and trends happening not just around your brand, but around your industry as a whole, and use those insights to make better Marketing decisions.
REQUEST FOR SAMPLE
 REQUEST FREE CUSTOMIZATION
Global Floating Storage Regasification Unit Market size was valued at USD 7.9 Billion in 2024 and is poised to grow from USD 8.41 Billion in 2025 to USD 13.92 Billion by 2033, growing at a CAGR of 6.5% during the forecast period (2026-2033).
The FSRU market is intensifying as major operators pursue technology upgrades and strategic alliances to capture rising demand for flexible gas supply. Recent improvements in regasification efficiency and joint ventures announced at the FLNG & FSRU Congress 2025 illustrate how firms are leveraging innovation and partnerships to differentiate their fleets and expand service offerings. 'Excelerate Energy, Inc.', 'Höegh Evi Ltd.', 'New Fortress Energy Inc.', 'Mitsui O.S.K. Lines, Ltd.', 'BW LNG AS', 'Golar LNG Limited', 'TotalEnergies SE', 'Shell plc', 'GasLog Ltd.', 'Flex LNG Ltd.', 'Maran Gas Maritime Inc.', 'Dynagas Ltd.', 'Teekay LNG Partners L.P. (now part of Seapeak LLC)', 'Seapeak LLC', 'Mitsui & Co., Ltd.', 'Japan Petroleum Exploration Co., Ltd.', 'QatarEnergy LNG', 'Enagas, S.A.', 'Exmar NV', 'Nakilat Inc.'
Rising global demand for natural gas, driven by environmental policies and industrial growth, encourages utilities and large-scale users to adopt LNG as a cleaner alternative to coal and oil. This shift motivates energy companies to invest in floating storage regasification units, which provide flexible, rapid deployment and can serve multiple markets without extensive onshore infrastructure. Consequently, the appeal of adaptable supply solutions accelerates project planning and fuels market expansion across regions seeking to diversify their energy mix. These units also enable quicker response to seasonal demand spikes.
Decarbonization Drive Accelerates Fsru Adoption: The global push toward net‑zero emissions is compelling energy firms to prioritize flexible, low‑carbon import solutions. Floating storage regasification units, which can be deployed quickly without extensive onshore infrastructure, are seen as a strategic bridge to accommodate fluctuating gas demand while supporting renewable integration. Stakeholders value the ability to relocate assets as market conditions evolve, reducing stranded‑asset risk and aligning with climate‑friendly policies, thereby positioning FSRUs as a preferred option for future gas supply strategies in a dynamic energy market.
Why does Asia Pacific Dominate the Global Floating Storage Regasification Unit Market? |@12


Want to customize this report? This report can be personalized according to your needs. Our analysts and industry experts will work directly with you to understand your requirements and provide you with customized data in a short amount of time. We offer $1000 worth of FREE customization at the time of purchase.
Feedback From Our Clients


 USA (+1) 351-333-4748

