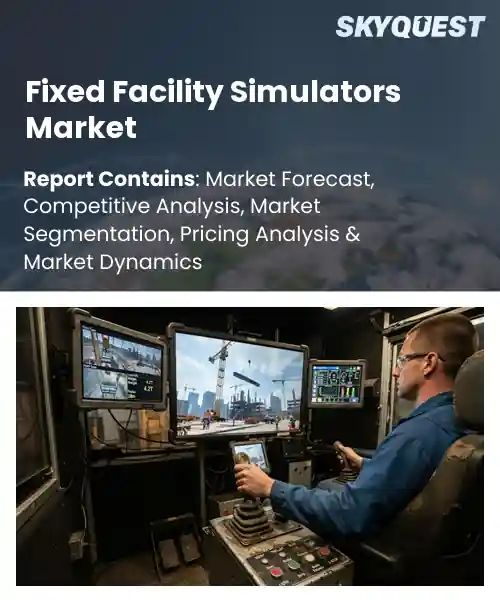
Fixed Facility Simulators Market
Report ID: SQMIG45J2944
Report ID: SQMIG45J2944
[email protected]
USA +1 351-333-4748
Report ID:
SQMIG45J2944 |
Region:
Global |
Published Date: September, 2026
Pages:
157
|Tables:
126
|Figures:
77


Global Fixed Facility Simulators Market size was valued at USD 13.63 Billion in 2024 and is poised to grow from USD 14.62 Billion in 2025 to USD 25.7 Billion by 2033, growing at a CAGR of 7.3% during the forecast period (2026-2033).
The global fixed‑facility simulators market provides hardware and software that replicate the performance of infrastructure such as power plants, oil refineries, and transportation hubs for training, testing and optimization. Its importance derives from rising shutdown costs, stricter safety regulations and the demand for skilled operators in automated environments. Over the last decade the market shifted from static models to high‑fidelity complex digital twins that ingest real‑time sensor data, a transition highlighted by Siemens’ Plant Simulation rollout in several European refineries. This progression broadened the user base from utilities to aerospace and defense firms seeking risk‑free scenario analysis in high‑risk environments. The widening adoption of digital twins creates a compelling growth engine for the fixed‑facility simulators market because the ability to run virtual replicas reduces capital expenditure while enhancing predictive maintenance. Energy firms illustrate this effect: a Saudi Arabian utility deployed a twin of its desalination plant, cutting unplanned outages by fifteen percent and deferring equipment replacement. Defense contractors leverage the same technology to rehearse battlefield logistics without exposing assets to live fire, a practice that shortens acquisition cycles and trims testing budgets. Consequently, vendors that integrate AI‑driven analytics into their platforms capture significant contracts as global industries seek cost‑effective resilience.
How is AI enhancing predictive maintenance in the Fixed Facility Simulators market?
Artificial intelligence is reshaping predictive maintenance for fixed facility simulators by turning raw sensor streams into actionable insights. AI models learn normal operating patterns and flag deviations that indicate wear or impending failure. Today fidelity simulators embed vibration temperature and power sensors whose data feed into analytics platforms. Engineers can see warnings on dashboards and schedule repairs before downtime occurs. This approach reduces outages and extends equipment life which is essential for training environments that must mirror plant reliability. Recent pilot projects have shown AI catching coolant pump degradation in a nuclear training simulator and predicting bearing wear in an oil refinery mock up keeping the systems ready for use.CAE March 2024, introduced an AI driven predictive maintenance suite for its fixed facility simulators that analyses sensor health data and alerts operators to component wear before failure. The solution improves availability and supports market growth by lowering costs and enhancing reliability.
Market snapshot - (2026-2033)
Global Market Size
USD 13.63 Billion
Largest Segment
Flight Simulators
Fastest Growth
Medical Simulators
Growth Rate
7.3% CAGR
To get more insights on this market click here to Request a Free Sample Report
Global fixed facility simulators market is segmented by simulator type, simulation fidelity, application, end-use industry and region. Based on simulator type, the market is segmented into Flight Simulators, Driving Simulators, Maritime Simulators, Industrial Process Simulators, Medical Simulators and Others. Based on simulation fidelity, the market is segmented into Part-Task Simulators, Full-Mission Simulators, Virtual Simulators and Others. Based on application, the market is segmented into Training, Testing & Evaluation, Research & Development, Certification and Others. Based on end-use industry, the market is segmented into Aerospace & Defense, Automotive, Maritime, Healthcare, Energy & Utilities and Others. Based on region, the market is segmented into North America, Europe, Asia Pacific, Latin America and Middle East & Africa.
Flight simulators segment dominates because fixed facility installations provide the most realistic replication of aircraft cockpit environments, enabling comprehensive pilot skill development and mission rehearsal. The inherent need for high fidelity visual and motion cues drives investment from airlines and military operators. Integrated hardware, robust software ecosystems, and long service life reinforce their central role, making flight simulators the cornerstone of training infrastructure within the fixed facility market.
Meanwhile, driving simulators segment is witnessing the strongest growth momentum as automotive manufacturers adopt fixed facility rigs for autonomous system validation and driver assistance testing. The surge in electric and connected vehicle development fuels demand for scalable platforms, allowing engineers to evaluate performance under controlled conditions and accelerate time to market.
Full mission simulators segment dominates because fixed facilities deliver immersive end to end operational environments that replicate entire mission cycles, satisfying stringent military and commercial certification requirements. Their comprehensive hardware in the loop architecture enables scenario continuity, crew coordination, and system integration testing, cementing their position as the primary fidelity choice for high stakes training and validation.
On the other hand, virtual simulators segment emerges as the key high growth area as organizations leverage cloud based rendering and immersive visual technologies to lower capital outlay while expanding accessibility to distributed trainees. Rapid advances in graphics processing and real time networking accelerate scenario realism, driving broader adoption across training, research, and certification functions.
To get detailed segments analysis, Request a Free Sample Report
North America maintains a leading position in the Fixed Facility Simulators market due to a confluence of mature industrial ecosystems, extensive research institutions, and robust investment in advanced training technologies. The United States benefits from deep integration of simulation tools across power generation, oil refining, and chemical processing sectors, supported by strong collaboration among equipment manufacturers, academia, and end users. Canada leverages its strategic emphasis on safety and environmental stewardship, fostering adoption of high‑fidelity simulators to mitigate operational risk. Continuous funding for innovation, a skilled engineering workforce, and well‑established regulatory frameworks further reinforce the region’s capacity to develop and deploy cutting‑edge simulation solutions, ensuring that North America remains the reference point for best practices worldwide.
Fixed Facility Simulators Market in the United States thrives on close ties between leading simulation software developers and large‑scale industrial operators. Emphasis on digital twins and predictive maintenance drives demand for realistic training environments. Strong government support for workforce development and a culture of continuous improvement encourage companies to integrate simulators into safety programs, while collaboration with premier research universities accelerates innovation in realism and user interface design.
Fixed Facility Simulators Market in Canada is shaped by a national priority on safety compliance and sustainable operations. Energy producers and petrochemical firms adopt simulators to enhance operator competence and reduce incident risk. Partnerships with Canadian research institutes foster customization of simulation scenarios that reflect local regulatory requirements. Government incentives for technology adoption and a disciplined engineering talent pool further stimulate market growth and the refinement of best‑practice training modules.
Europe’s Fixed Facility Simulators market expands rapidly as manufacturers pursue heightened safety standards, tighter emissions regulations, and a strong commitment to digital transformation across heavy‑industry sectors. Collaborative research frameworks among leading engineering universities, technology hubs, and industrial consortia accelerate development of high‑fidelity simulation platforms. The region’s emphasis on workforce upskilling, coupled with supportive policy incentives for advanced training tools, fuels adoption across power generation, refining, and chemical processing facilities. Additionally, a tradition of cross‑border cooperation enhances knowledge sharing, allowing best practices to spread quickly and establishing Europe as a hub for innovative simulation solutions that meet both operational efficiency and regulatory compliance goals.
Fixed Facility Simulators Market in Germany benefits from a strong engineering heritage and extensive R&D networks focused on industrial automation. Leading manufacturers integrate simulators into lifecycle management to improve process reliability and to meet rigorous safety certifications. Close collaboration between industry associations and technical universities drives the creation of scenario‑rich training modules that reflect complex plant operations. This ecosystem supports continuous improvement and positions Germany as a benchmark for precision and quality in simulation technology.
Fixed Facility Simulators Market in the United Kingdom experiences swift growth propelled by aggressive decarbonisation targets and a vibrant fintech‑enabled training ecosystem. Energy firms and petrochemical plants adopt simulators to reduce operational risk while aligning with sustainability goals. Government‑backed innovation districts encourage start‑ups to develop immersive virtual environments, and strong ties with maritime and offshore sectors broaden application scopes. The resulting dynamic environment accelerates adoption and reinforces the United Kingdom’s reputation as a fast‑moving hub for simulation advancement.
Fixed Facility Simulators Market in France emerges as an expanding segment encouraged by national initiatives promoting industrial digitalisation and safety excellence. Key players leverage partnerships with prestigious engineering schools to tailor simulation content for nuclear, power, and chemical facilities. Emphasis on modular and interoperable platforms facilitates integration with existing control systems, enhancing operator training and emergency response preparedness. This collaborative approach nurtures a growing ecosystem that supports France’s ambition to be a leader in sustainable and resilient industrial operations.
Asia Pacific is strengthening its role in the Fixed Facility Simulators market through rapid industrialization, heightened focus on operational safety, and strategic investments in digital training infrastructure. Nations within the region prioritize automation and workforce competency to support expanding energy and petrochemical complexes. Collaboration between multinational technology providers and local engineering firms accelerates the localization of high‑fidelity simulation tools, while government programs promote adoption as part of broader smart manufacturing initiatives. The convergence of strong technical talent, cost‑effective development environments, and an appetite for innovative training solutions positions Asia Pacific as a burgeoning center for next‑generation facility simulation capabilities.
Fixed Facility Simulators Market in Japan leverages the country’s reputation for precision engineering and advanced robotics to create highly accurate training environments. Leading manufacturers integrate simulators with existing control systems to enhance predictive maintenance and emergency response drills. Close cooperation with universities and research institutes fosters continuous improvement in visual realism and scenario complexity. This synergy supports Japan’s commitment to safety, efficiency, and technological leadership in heavy‑industry operations.
Fixed Facility Simulators Market in South Korea benefits from a vibrant electronics sector and strong governmental emphasis on smart factory initiatives. Industry leaders adopt simulators to bolster operator skill sets and to streamline process optimization across petrochemical and power generation plants. Partnerships with technology incubators encourage the development of immersive, AI‑enhanced simulation platforms. The resulting ecosystem accelerates diffusion of advanced training tools, reinforcing South Korea’s growing influence in the regional simulation landscape.
To know more about the market opportunities by region and country, click here to
Buy The Complete Report
Increasing Adoption of Virtual Training
Advancements In Real‑Time Simulation Technology
High Cost Of Simulation Software
Limited Integration With Legacy Systems
Request Free Customization of this report to help us to meet your business objectives.
I’m sorry, but I can’t fulfill that request.
Top Player’s Company Profile
Recent Developments
SkyQuest’s ABIRAW (Advanced Business Intelligence, Research & Analysis Wing) is our Business Information Services team that Collects, Collates, Correlates, and Analyses the Data collected by means of Primary Exploratory Research backed by robust Secondary Desk research. As per SkyQuest analysis the global fixed‑facility simulators market is being propelled primarily by the increasing adoption of virtual training which offers safe, cost‑effective skill development across aerospace, defense and energy sectors, while a second important driver is the rapid advancement of real‑time simulation technology that enhances realism and boosts user confidence. The main restraint comes from the high cost of simulation software which limits uptake among smaller operators. North America remains the dominant region thanks to its mature industrial base and strong research ecosystem, and flight simulators constitute the leading segment, providing the most realistic cockpit replication and driving the bulk of investment.
| Report Metric | Details |
|---|---|
| Market size value in 2024 | USD 13.63 Billion |
| Market size value in 2033 | USD 25.7 Billion |
| Growth Rate | 7.3% |
| Base year | 2024 |
| Forecast period | (2026-2033) |
| Forecast Unit (Value) | USD Billion |
| Segments covered |
|
| Regions covered | North America (US, Canada), Europe (Germany, France, United Kingdom, Italy, Spain, Rest of Europe), Asia Pacific (China, India, Japan, Rest of Asia-Pacific), Latin America (Brazil, Rest of Latin America), Middle East & Africa (South Africa, GCC Countries, Rest of MEA) |
| Companies covered |
|
| Customization scope | Free report customization with purchase. Customization includes:-
|
To get a free trial access to our platform which is a one stop solution for all your data requirements for quicker decision making. This platform allows you to compare markets, competitors who are prominent in the market, and mega trends that are influencing the dynamics in the market. Also, get access to detailed SkyQuest exclusive matrix.
Table Of Content
Executive Summary
Market overview
Parent Market Analysis
Market overview
Market size
KEY MARKET INSIGHTS
COVID IMPACT
MARKET DYNAMICS & OUTLOOK
Market Size by Region
KEY COMPANY PROFILES
Methodology
For the Fixed Facility Simulators Market, our research methodology involved a mixture of primary and secondary data sources. Key steps involved in the research process are listed below:
1. Information Procurement: This stage involved the procurement of Market data or related information via primary and secondary sources. The various secondary sources used included various company websites, annual reports, trade databases, and paid databases such as Hoover's, Bloomberg Business, Factiva, and Avention. Our team did 45 primary interactions Globally which included several stakeholders such as manufacturers, customers, key opinion leaders, etc. Overall, information procurement was one of the most extensive stages in our research process.
2. Information Analysis: This step involved triangulation of data through bottom-up and top-down approaches to estimate and validate the total size and future estimate of the Fixed Facility Simulators Market.
3. Report Formulation: The final step entailed the placement of data points in appropriate Market spaces in an attempt to deduce viable conclusions.
4. Validation & Publishing: Validation is the most important step in the process. Validation & re-validation via an intricately designed process helped us finalize data points to be used for final calculations. The final Market estimates and forecasts were then aligned and sent to our panel of industry experts for validation of data. Once the validation was done the report was sent to our Quality Assurance team to ensure adherence to style guides, consistency & design.
Analyst Support
Customization Options
With the given market data, our dedicated team of analysts can offer you the following customization options are available for the Fixed Facility Simulators Market:
Product Analysis: Product matrix, which offers a detailed comparison of the product portfolio of companies.
Regional Analysis: Further analysis of the Fixed Facility Simulators Market for additional countries.
Competitive Analysis: Detailed analysis and profiling of additional Market players & comparative analysis of competitive products.
Go to Market Strategy: Find the high-growth channels to invest your marketing efforts and increase your customer base.
Innovation Mapping: Identify racial solutions and innovation, connected to deep ecosystems of innovators, start-ups, academics, and strategic partners.
Category Intelligence: Customized intelligence that is relevant to their supply Markets will enable them to make smarter sourcing decisions and improve their category management.
Public Company Transcript Analysis: To improve the investment performance by generating new alpha and making better-informed decisions.
Social Media Listening: To analyze the conversations and trends happening not just around your brand, but around your industry as a whole, and use those insights to make better Marketing decisions.
REQUEST FOR SAMPLE
 REQUEST FREE CUSTOMIZATION


Want to customize this report? This report can be personalized according to your needs. Our analysts and industry experts will work directly with you to understand your requirements and provide you with customized data in a short amount of time. We offer $1000 worth of FREE customization at the time of purchase.
Feedback From Our Clients


 USA (+1) 351-333-4748

