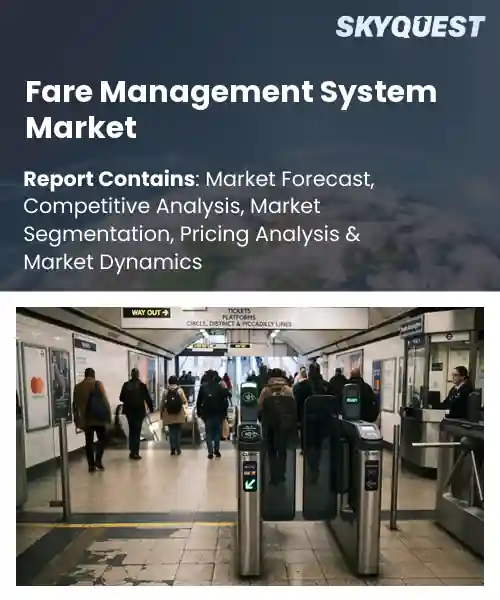
Fare Management System Market
Report ID: SQMIG45E3349
Report ID: SQMIG45E3349
[email protected]
USA +1 351-333-4748
Report ID:
SQMIG45E3349 |
Region:
Global |
Published Date: October, 2026
Pages:
157
|Tables:
146
|Figures:
78


Global Fare Management System Market size was valued at USD 12.8 Billion in 2024 and is poised to grow from USD 14.27 Billion in 2025 to USD 34.1 Billion by 2033, growing at a CAGR of 11.5% during the forecast period (2026-2033).
The fare management system market encompasses software and hardware solutions that calculate, collect, and reconcile transportation charges for airlines, railways, and public transit operators. Its significance stems from the need to optimize revenue while delivering passenger experiences, especially as mobility services become digital. Historically, the market emerged from simple ticket‑printing machines in the 1970s and evolved through the adoption of magnetic stripe cards in the 1990s, followed by contactless smart cards and ticketing platforms in the 2010s. A driver of this evolution is the proliferation of that compel operators to replace legacy fare tables with pricing engines capable of adjustment. Regulatory pressure for fare structures constitutes a key factor shaping the fare management system market, because authorities demand reporting and auditability, which forces operators to upgrade platforms. As a result, vendors that embed compliance modules, such as GDPR‑aligned data handling and carbon‑offset tracking, see heightened demand from European railways and North American bus agencies. This push also creates opportunities for cloud‑based ecosystems that can aggregate pricing data, enabling cities to implement ticketing across buses, subways, and bike‑share schemes. For example, Singapore deployed a unified fare platform that cut settlement time by 30 percent, showing how compliance‑driven innovation yields efficiency and revenue.
How is AI improving fare management system efficiency in public transportation?
AI boosts fare‑management efficiency by turning raw transaction data into actionable insights. Real‑time analytics enable operators to adjust pricing on the fly, match capacity with demand, and spot anomalies that signal fare evasion. Machine‑learning models predict peak travel periods, allowing smoother cash‑less boarding and reducing bottlenecks at validators. Integrated AI also streamlines back‑office reconciliation, cutting manual entry errors and shortening settlement cycles. Cities adopting these tools report smoother passenger experiences and lower operational costs, while transit agencies gain clearer visibility into revenue streams and can allocate resources more strategically across the network. The market is therefore shifting toward fully automated, data‑driven fare ecosystems.In March 2024, Masabi announced a partnership with Google Cloud to embed AI‑driven fare optimization and fraud detection into its mobile ticketing platform, accelerating market efficiency.
Market snapshot - (2026-2033)
Global Market Size
USD 12.8 Billion
Largest Segment
Software
Fastest Growth
Services
Growth Rate
11.5% CAGR
To get more insights on this market click here to Request a Free Sample Report
Global fare management system market is segmented by offering, payment technology, deployment, transport mode, end user and region. Based on offering, the market is segmented into Hardware, Software and Services. Based on payment technology, the market is segmented into Smart Cards, Contactless Bank Cards, Mobile Ticketing & QR Codes, Account-Based Ticketing and Cash-Based Ticketing. Based on deployment, the market is segmented into On-Premise and Cloud-Based. Based on transport mode, the market is segmented into Bus, Rail & Metro, Ferry & Water Transport and Multimodal Transport. Based on end user, the market is segmented into Public Transit Authorities, Private Transit Operators and Integrated Mobility Providers. Based on region, the market is segmented into North America, Europe, Asia Pacific, Latin America and Middle East & Africa.
Contactless Bank Cards segment dominates because they offer seamless, fast transactions that meet modern rider expectations for convenience and security, reducing boarding times and operational friction for transit agencies. Their widespread adoption by financial institutions creates a trusted ecosystem, encouraging passengers to use familiar payment methods rather than learning new fare media. Consequently, operators can streamline fare collection, lower cash handling costs, and improve revenue assurance across diverse networks.
Meanwhile, Mobile Ticketing & QR Codes segment is witnessing the strongest growth momentum because smartphones proliferate and riders seek contactless, app‑based experiences, prompting operators to launch flexible, on‑the‑go ticket options. This digital shift fuels new revenue streams, enhances data insights, and expands market reach, accelerating overall fare system innovation and adoption.
Cloud-Based deployment stands out because it provides scalable, always‑up‑to‑date infrastructure that eliminates heavy upfront capital expenditure for transit agencies, enabling rapid rollout of new fare functionalities across multiple jurisdictions. Elastic resources adapt to fluctuating passenger volumes, ensuring reliability during peak periods, while centralized management simplifies maintenance and security patches. These advantages accelerate digital transformation, improve system resilience, and support broader integration with mobility platforms.
Conversely, On-Premise deployment is emerging as the key high‑growth area because certain operators require strict data sovereignty and customized integration with legacy control systems, driving investments in dedicated hardware and localized software suites. This focus spurs niche vendor innovation, creates specialized service opportunities, and expands market depth as agencies balance control with emerging technology needs.
To get detailed segments analysis, Request a Free Sample Report
North America benefits from a highly mature airline ecosystem where carriers have long embraced digital transformation. The region’s carriers are supported by sophisticated ticketing infrastructures and extensive data analytics capabilities that enable real‑time fare optimization. Strong collaboration between technology providers, regulatory bodies, and financial institutions fosters an environment conducive to innovation and seamless integration of fare management solutions. Consumer expectations for personalized pricing and seamless booking experiences drive carriers to continuously enhance their fare management platforms. Additionally, the presence of major airline hubs and a concentration of industry expertise accelerates the adoption of advanced algorithms and cloud‑based services, reinforcing North America’s leading position.
Fare Management System Market in United States thrives on a culture of rapid technology adoption and deep investment in artificial intelligence driven pricing tools. Leading carriers leverage extensive data networks to fine‑tune fare structures, while a competitive landscape pushes continuous improvement. Partnerships with fintech innovators enhance payment flexibility, and robust regulatory frameworks ensure transparency and consumer trust, supporting sustained market leadership.
Fare Management System Market in Canada reflects a strategic focus on integrating regional airline networks with cutting‑edge pricing engines. Emphasis on multilingual support and cross‑border ticketing solutions strengthens its appeal to both domestic and international travelers. Collaborative initiatives between airlines and technology firms foster the development of user‑centric platforms, while governmental encouragement of digital infrastructure underpins steady growth in fare management capabilities.
Europe’s fare management landscape is energized by a concerted push toward harmonized ticketing standards across multiple jurisdictions, which simplifies cross‑border travel and encourages airline collaboration. The region’s carriers are investing heavily in sophisticated revenue management systems that incorporate real‑time market intelligence and passenger behavior analytics. Strong regulatory emphasis on consumer protection and price transparency compels airlines to adopt more dynamic and flexible pricing mechanisms. Moreover, the presence of a vibrant fintech ecosystem and growing demand for seamless omnichannel booking experiences fuels rapid adoption of innovative fare solutions, positioning Europe as a hotbed of market expansion.
Fare Management System Market in Germany benefits from a robust engineering tradition and a dense network of legacy carriers undergoing digital upgrades. Emphasis on precision pricing and integration with extensive railway and intermodal transport options creates a comprehensive travel pricing ecosystem. Collaborative research initiatives between airlines and software developers drive continuous enhancement of algorithmic fare setting, while regulatory consistency across the European Union supports market stability and growth.
Fare Management System Market in United Kingdom is distinguished by its swift adoption of cloud‑native fare optimization platforms that enable rapid response to market fluctuations. A strong focus on customer personalization and real‑time fare adjustments aligns with the competitive dynamics of the region’s airline sector. Close ties between fintech innovators and carriers encourage the rollout of flexible payment options, while regulatory encouragement of open data initiatives fosters greater transparency and agility in fare management processes.
Fare Management System Market in France is emerging through concerted efforts to modernize legacy pricing systems and integrate them with advanced analytics tools. Emphasis on enhancing traveler experience through dynamic pricing and mobile‑first booking channels drives investment in next‑generation fare solutions. Partnerships with technology incubators and a supportive regulatory environment promote experimentation, allowing carriers to refine pricing strategies and expand market reach within the broader European context.
Asia Pacific is solidifying its role in fare management through a combination of rapid digital adoption, burgeoning middle‑class travel demand, and strategic governmental support for smart transportation initiatives. Airlines across the region are implementing AI‑driven pricing models that accommodate diverse market segments and fluctuating demand patterns. The proliferation of mobile commerce platforms and increasing connectivity enable seamless integration of fare management tools with consumer‑facing applications. Collaborative ecosystems involving telecom operators, fintech firms, and airline carriers further enhance the sophistication of pricing solutions, positioning the region as a dynamic contributor to the global fare management landscape.
Fare Management System Market in Japan reflects a meticulous approach to integrating high‑precision pricing algorithms with a culture of punctuality and service excellence. Airlines leverage extensive passenger data to deliver tailored fare options and streamline booking workflows. Close collaboration with technology conglomerates accelerates the deployment of cloud‑based fare platforms, while regulatory encouragement of open data standards enhances interoperability across travel channels, supporting sustained market advancement.
Fare Management System Market in South Korea showcases a forward‑looking mindset, embracing mobile‑first solutions and real‑time fare recalibration. Carriers prioritize seamless integration with digital wallets and messaging platforms, catering to tech‑savvy travelers. Strong government backing for smart transport initiatives fuels investment in AI‑enabled pricing engines, and partnerships with local technology startups drive continuous innovation in fare management capabilities.
To know more about the market opportunities by region and country, click here to
Buy The Complete Report
Increasing Airline Digitalization
Adoption of Cloud-Based Solutions
Data Privacy Regulations
High Implementation Costs
Request Free Customization of this report to help us to meet your business objectives.
I’m sorry, but I can’t fulfill that request.
Top Player’s Company Profile
Recent Developments
SkyQuest’s ABIRAW (Advanced Business Intelligence, Research & Analysis Wing) is our Business Information Services team that Collects, Collates, Correlates, and Analyses the Data collected by means of Primary Exploratory Research backed by robust Secondary Desk research. As per SkyQuest analysis, the fare management system market is being propelled chiefly by the rapid digitalisation of airlines, which pushes carriers to consolidate pricing, inventory and distribution into unified platforms, while the parallel shift toward cloud‑based deployments adds a second driver by offering scalable, low‑capex solutions that accelerate new fare features. The market’s growth is tempered by stringent data‑privacy regulations that raise compliance costs and slow adoption, especially for smaller operators. North America remains the dominant region thanks to its mature airline ecosystem and strong fintech partnerships, and the contactless bank‑card payment technology segment leads the market by delivering fast, secure and familiar transactions to passengers.
| Report Metric | Details |
|---|---|
| Market size value in 2024 | USD 12.8 Billion |
| Market size value in 2033 | USD 34.1 Billion |
| Growth Rate | 11.5% |
| Base year | 2024 |
| Forecast period | (2026-2033) |
| Forecast Unit (Value) | USD Billion |
| Segments covered |
|
| Regions covered | North America (US, Canada), Europe (Germany, France, United Kingdom, Italy, Spain, Rest of Europe), Asia Pacific (China, India, Japan, Rest of Asia-Pacific), Latin America (Brazil, Rest of Latin America), Middle East & Africa (South Africa, GCC Countries, Rest of MEA) |
| Companies covered |
|
| Customization scope | Free report customization with purchase. Customization includes:-
|
To get a free trial access to our platform which is a one stop solution for all your data requirements for quicker decision making. This platform allows you to compare markets, competitors who are prominent in the market, and mega trends that are influencing the dynamics in the market. Also, get access to detailed SkyQuest exclusive matrix.
Table Of Content
Executive Summary
Market overview
Parent Market Analysis
Market overview
Market size
KEY MARKET INSIGHTS
COVID IMPACT
MARKET DYNAMICS & OUTLOOK
Market Size by Region
KEY COMPANY PROFILES
Methodology
For the Fare Management System Market, our research methodology involved a mixture of primary and secondary data sources. Key steps involved in the research process are listed below:
1. Information Procurement: This stage involved the procurement of Market data or related information via primary and secondary sources. The various secondary sources used included various company websites, annual reports, trade databases, and paid databases such as Hoover's, Bloomberg Business, Factiva, and Avention. Our team did 45 primary interactions Globally which included several stakeholders such as manufacturers, customers, key opinion leaders, etc. Overall, information procurement was one of the most extensive stages in our research process.
2. Information Analysis: This step involved triangulation of data through bottom-up and top-down approaches to estimate and validate the total size and future estimate of the Fare Management System Market.
3. Report Formulation: The final step entailed the placement of data points in appropriate Market spaces in an attempt to deduce viable conclusions.
4. Validation & Publishing: Validation is the most important step in the process. Validation & re-validation via an intricately designed process helped us finalize data points to be used for final calculations. The final Market estimates and forecasts were then aligned and sent to our panel of industry experts for validation of data. Once the validation was done the report was sent to our Quality Assurance team to ensure adherence to style guides, consistency & design.
Analyst Support
Customization Options
With the given market data, our dedicated team of analysts can offer you the following customization options are available for the Fare Management System Market:
Product Analysis: Product matrix, which offers a detailed comparison of the product portfolio of companies.
Regional Analysis: Further analysis of the Fare Management System Market for additional countries.
Competitive Analysis: Detailed analysis and profiling of additional Market players & comparative analysis of competitive products.
Go to Market Strategy: Find the high-growth channels to invest your marketing efforts and increase your customer base.
Innovation Mapping: Identify racial solutions and innovation, connected to deep ecosystems of innovators, start-ups, academics, and strategic partners.
Category Intelligence: Customized intelligence that is relevant to their supply Markets will enable them to make smarter sourcing decisions and improve their category management.
Public Company Transcript Analysis: To improve the investment performance by generating new alpha and making better-informed decisions.
Social Media Listening: To analyze the conversations and trends happening not just around your brand, but around your industry as a whole, and use those insights to make better Marketing decisions.
REQUEST FOR SAMPLE
 REQUEST FREE CUSTOMIZATION


Want to customize this report? This report can be personalized according to your needs. Our analysts and industry experts will work directly with you to understand your requirements and provide you with customized data in a short amount of time. We offer $1000 worth of FREE customization at the time of purchase.
Feedback From Our Clients


 USA (+1) 351-333-4748

