
Product ID: UCMIG45E2191
Report ID:
UCMIG45E2191 |
Region:
Global |
Published Date: Upcoming |
Pages:
165
| Tables: 55 | Figures: 60
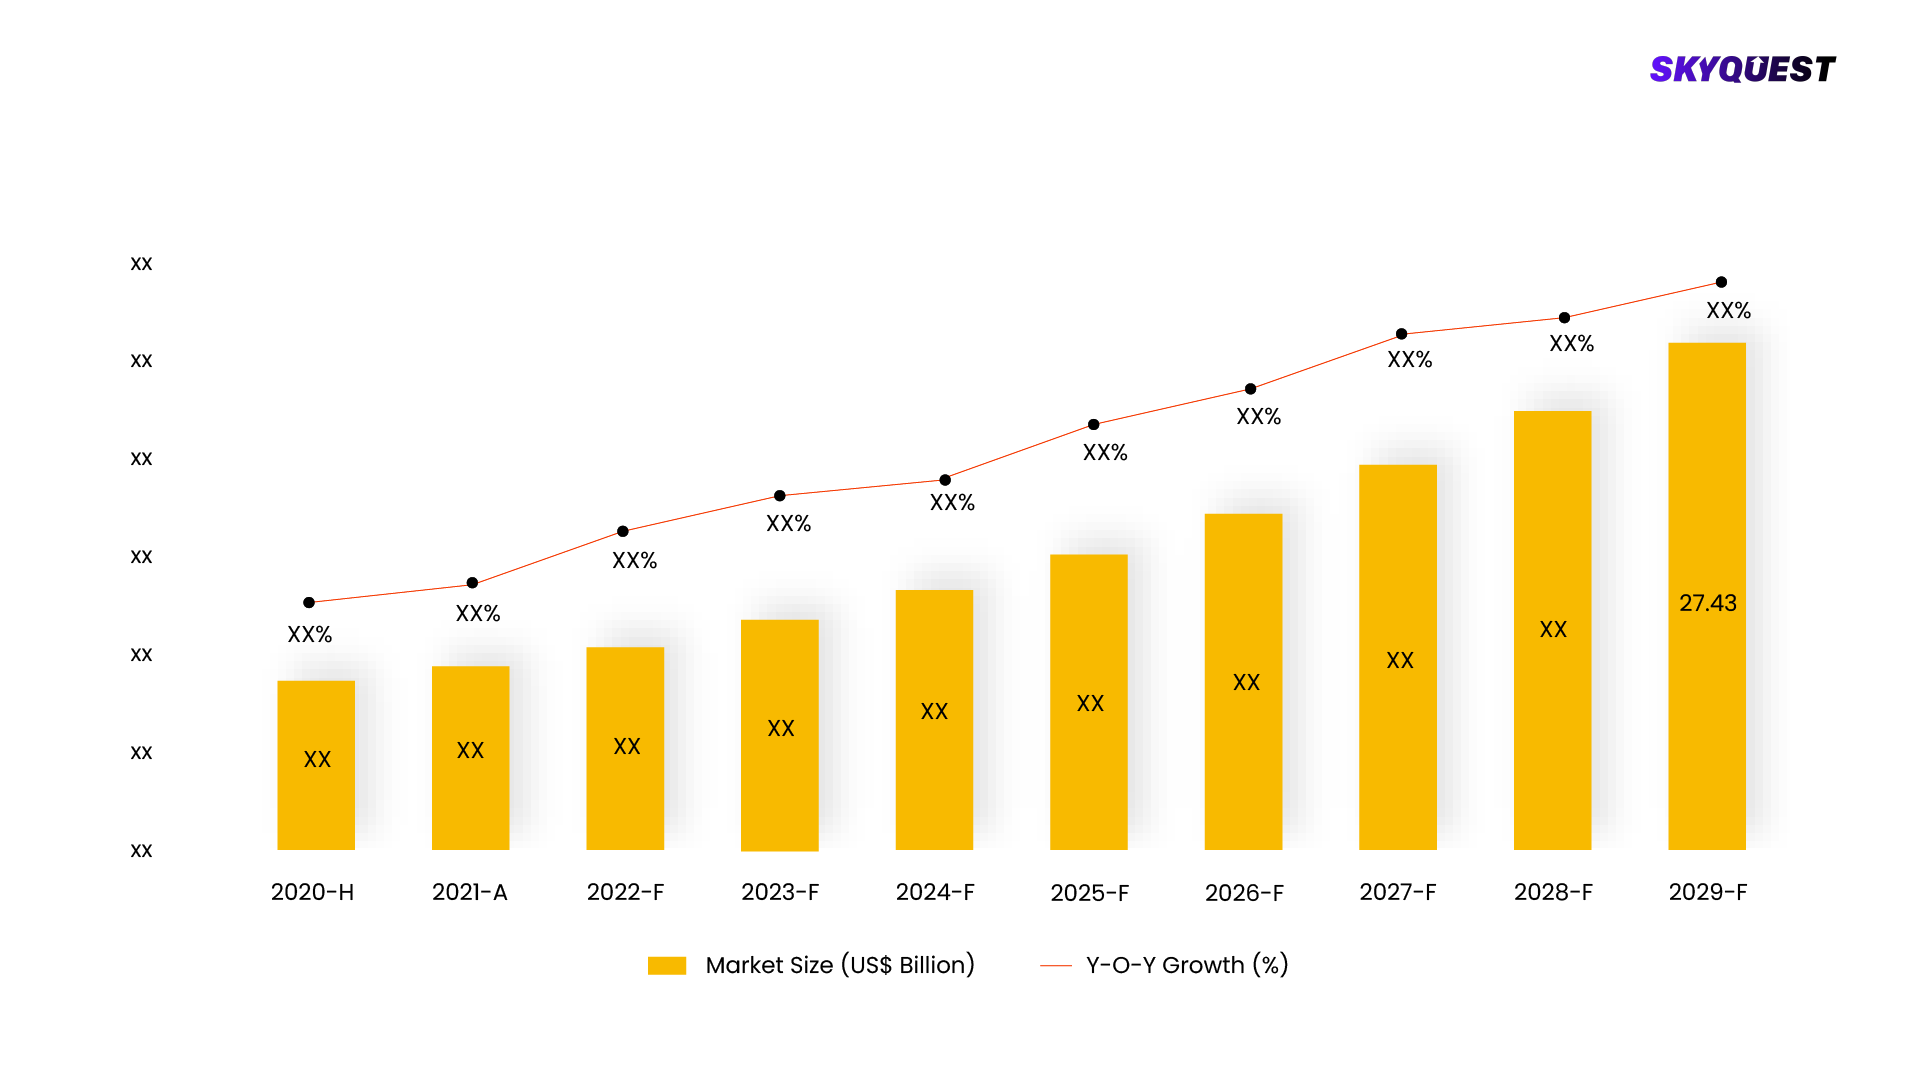
The Electronic Design Automation (EDA) Market, surpassing USD 10 billion in 2020, is poised for steady growth with an anticipated CAGR of around 8% from 2021 to 2027. EDA tools play a critical role in the development and design of electronic systems, including Integrated Circuits (ICs) and Printed Circuit Boards (PCBs). This market encompasses the commercialization of tools, workflows, and methodologies integral to the fabrication of electronic systems. As technological complexities and demands for innovation in electronic design continue to rise, the EDA market remains vital in enabling efficient and sophisticated solutions, driving its consistent expansion and maintaining its pivotal role in shaping the future of electronics.
This report is being written to illustrate the market opportunity by region and by segments, indicating opportunity areas for the vendors to tap upon. To estimate the opportunity, it was very important to understand the current market scenario and the way it will grow in future.
Production and consumption patterns are being carefully compared to forecast the market. Other factors considered to forecast the market are the growth of the adjacent market, revenue growth of the key market vendors, scenario-based analysis, and market segment growth.
The market size was determined by estimating the market through a top-down and bottom-up approach, which was further validated with industry interviews. Considering the nature of the market we derived the Application Software by segment aggregation, the contribution of the Application Software in Software & Services and vendor share.
To determine the growth of the market factors such as drivers, trends, restraints, and opportunities were identified, and the impact of these factors was analyzed to determine the market growth. To understand the market growth in detail, we have analyzed the year-on-year growth of the market. Also, historic growth rates were compared to determine growth patterns.
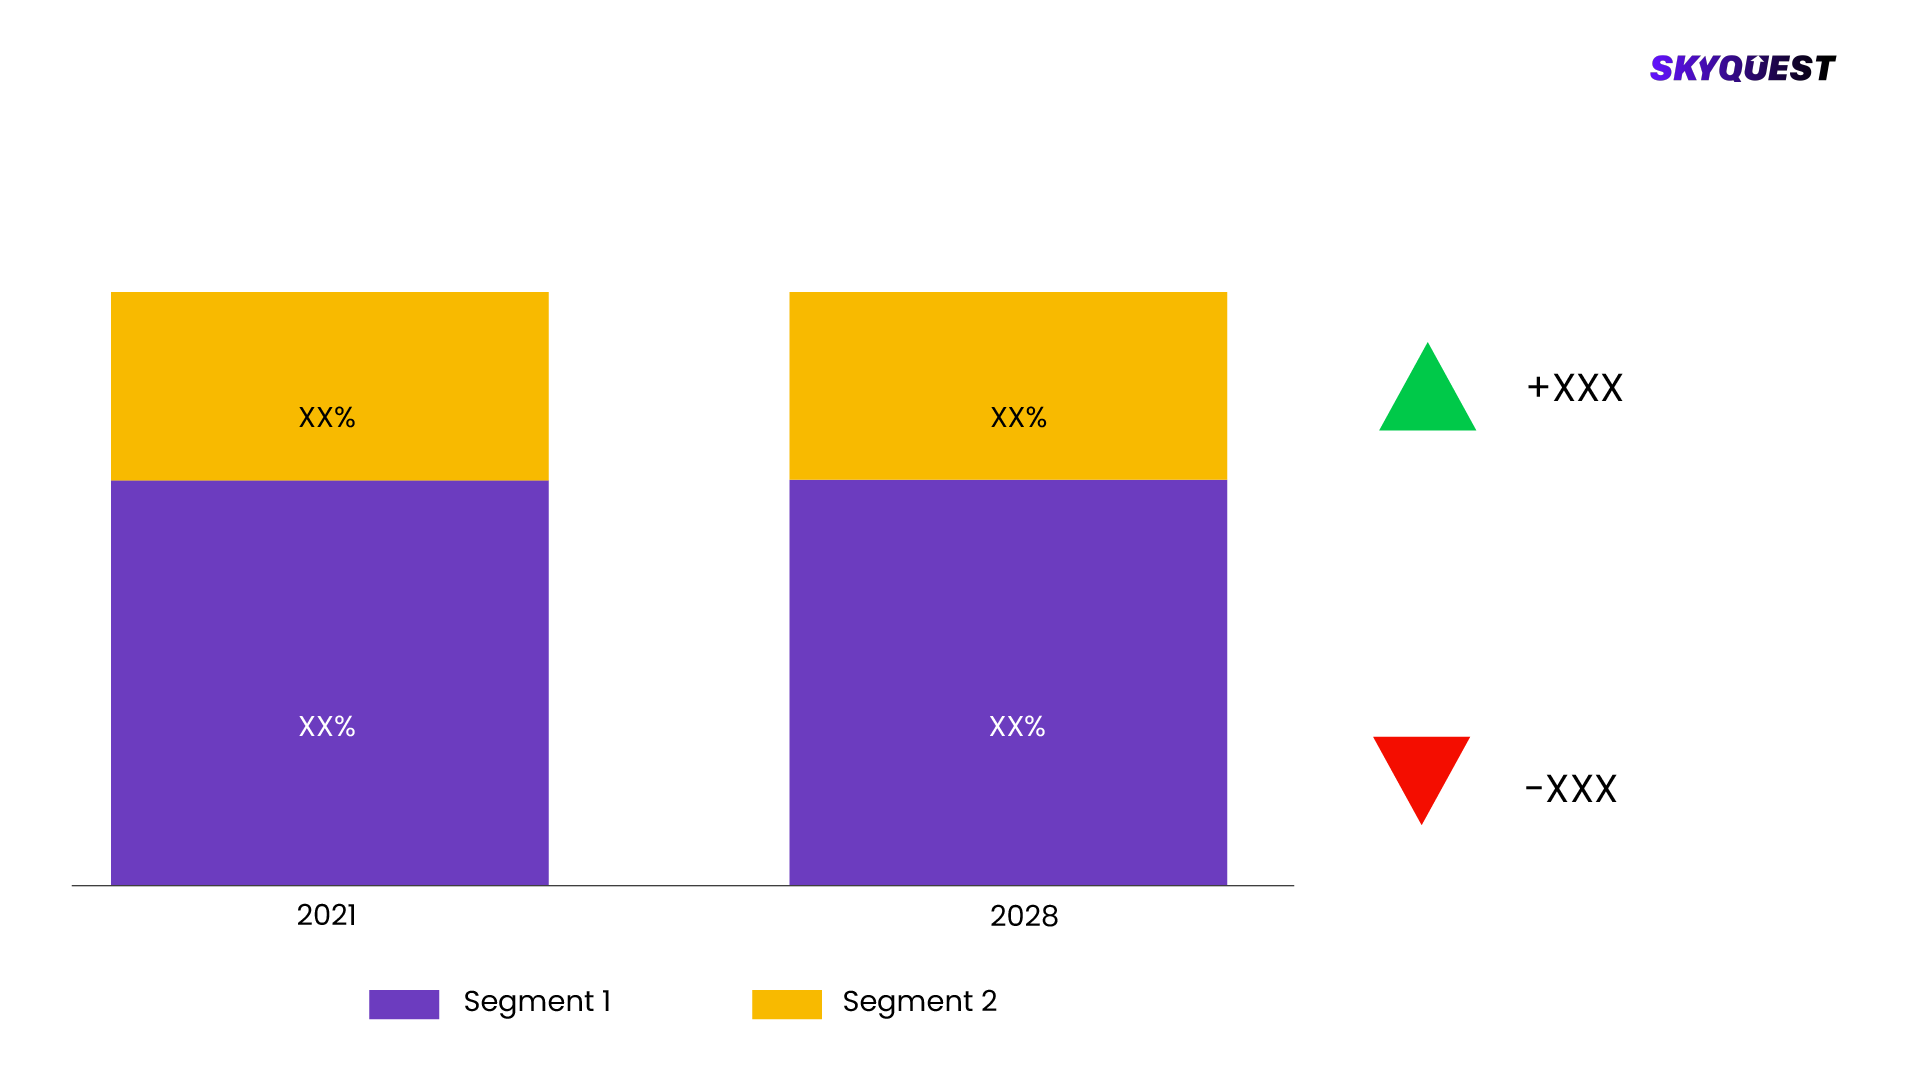
The Electronic Design Automation Market is segmented by Product, Application. We are analyzing the market of these segments to identify which segment is the largest now and in the future, which segment has the highest growth rate, and the segment which offers the opportunity in the future.
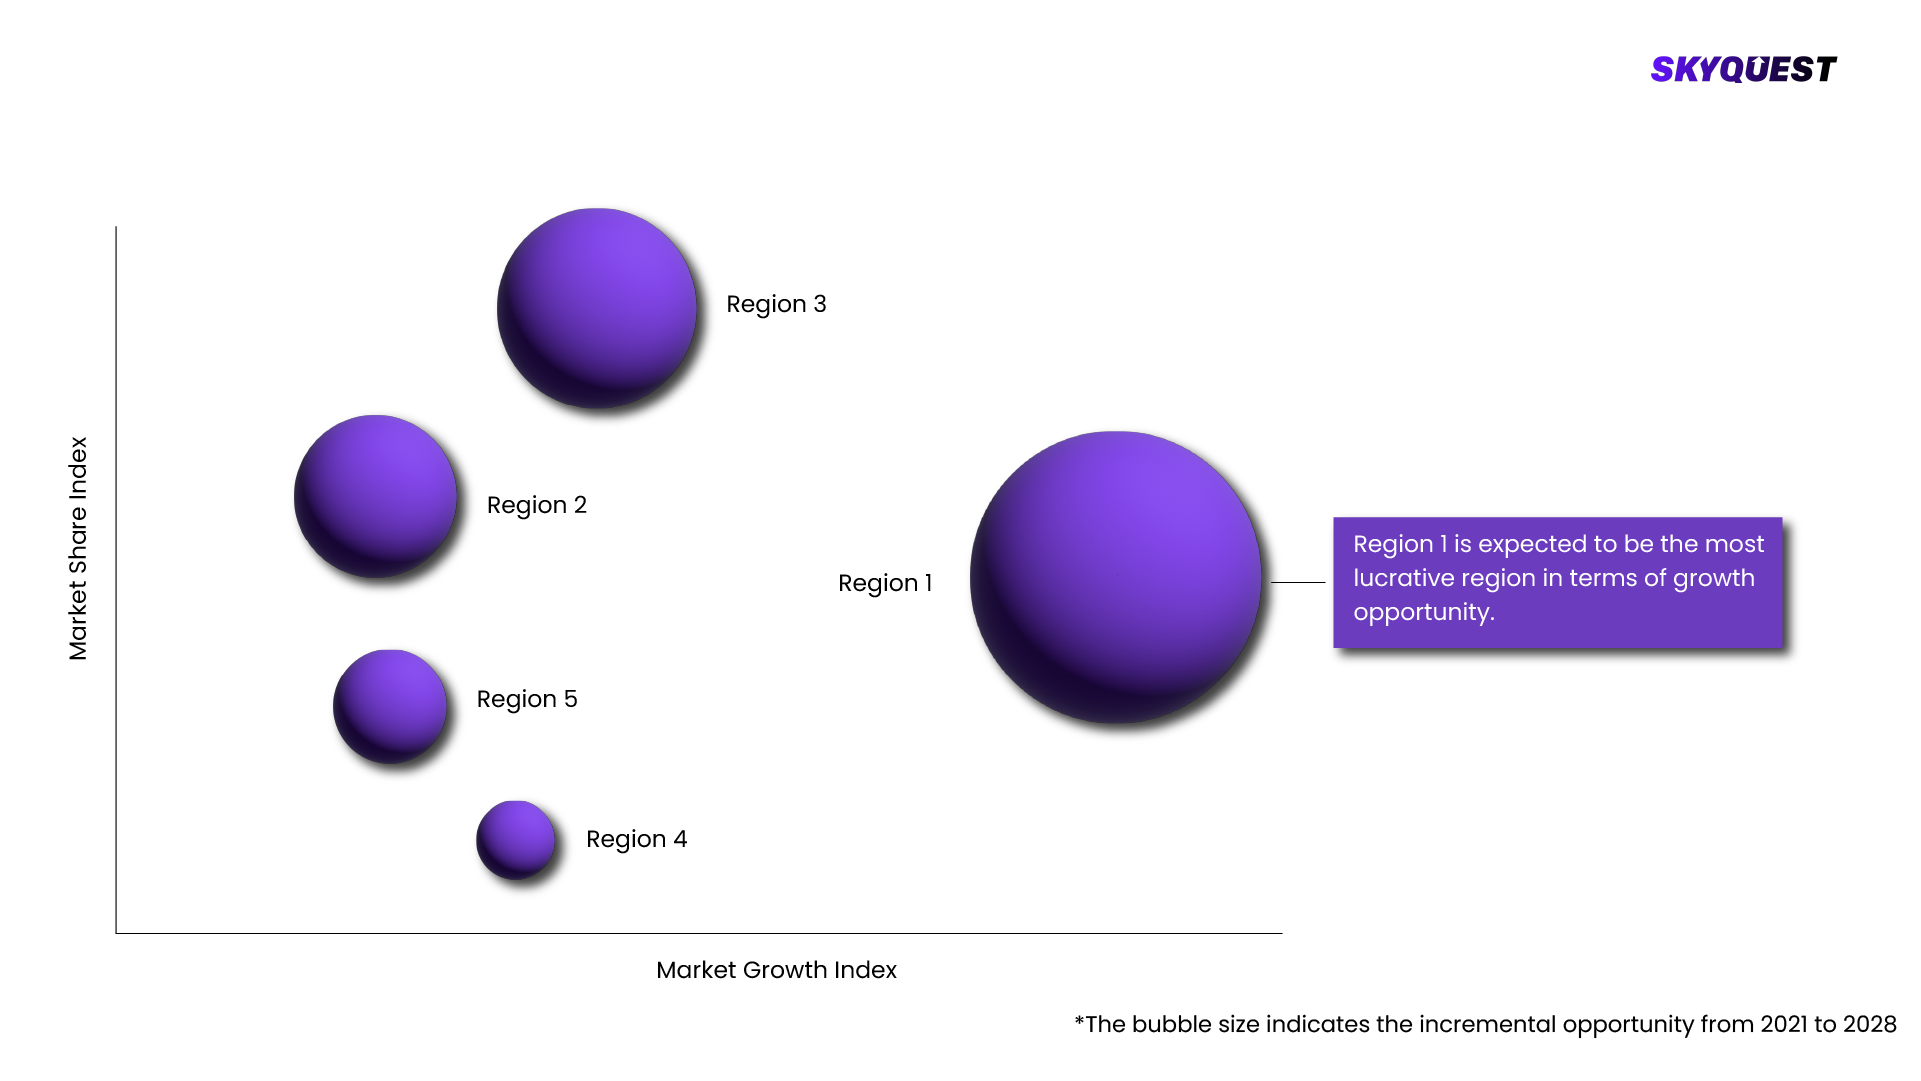
Electronic Design Automation Market is being analyzed by North America, Europe, Asia-Pacific (APAC), Latin America (LATAM), Middle East & Africa (MEA) regions. Key countries including the U.S., Canada, Germany, France, UK, Italy, Spain, China, India, Japan, Brazil, GCC Countries, and South Africa among others were analyzed considering various micro and macro trends.
SkyQuest's expert analysts have conducted a risk analysis to understand the impact of external extremities on Electronic Design Automation Market. We analyzed how geopolitical influence, natural disasters, climate change, legal scenario, economic impact, trade & economic policies, social & ethnic concerns, and demographic changes might affect Electronic Design Automation Market's supply chain, distribution, and total revenue growth.
To understand the competitive landscape, we are analyzing key Electronic Design Automation Market vendors in the market. To understand the competitive rivalry, we are comparing the revenue, expenses, resources, product portfolio, region coverage, market share, key initiatives, product launches, and any news related to the Electronic Design Automation Market.
To validate our hypothesis and validate our findings on the market ecosystem, we are also conducting a detailed porter's five forces analysis. Competitive Rivalry, Supplier Power, Buyer Power, Threat of Substitution, and Threat of New Entry each force is analyzed by various parameters governing those forces.
The Electronic Design Automation Market is being analyzed by SkyQuest's analysts with the help of 20+ scheduled Primary interviews from both the demand and supply sides. We have already invested more than 250 hours on this report and are still refining our date to provide authenticated data to your readers and clients. Exhaustive primary and secondary research is conducted to collect information on the market, peer market, and parent market.
Our cross-industry experts and revenue-impact consultants at SkyQuest enable our clients to convert market intelligence into actionable, quantifiable results through personalized engagement.
| Report Attribute | Details |
|---|---|
| The base year for estimation | 2021 |
| Historical data | 2016 – 2022 |
| Forecast period | 2022 – 2028 |
| Report coverage | Revenue forecast, volume forecast, company ranking, competitive landscape, growth factors, and trends, Pricing Analysis |
| Segments covered |
|
| Regional scope | North America, Europe, Asia-Pacific (APAC), Latin America (LATAM), Middle East & Africa (MEA) |
| Country scope | U.S., Canada, Germany, France, UK, Italy, Spain, China, India, Japan, Brazil, GCC Countries, South Africa |
| Key companies profiled |
|
| Customization scope | Free report customization (15% Free customization) with purchase. Addition or alteration to country, regional & segment scope. |
| Pricing and purchase options | Reap the benefits of customized purchase options to fit your specific research requirements. |
Executive Summary
Market overview
Parent Market Analysis
Market overview
Market size
KEY MARKET INSIGHTS
COVID IMPACT
MARKET DYNAMICS & OUTLOOK
Market Size by Region
KEY COMPANY PROFILES
For the Electronic Design Automation Market, our research methodology involved a mixture of primary and secondary data sources. Key steps involved in the research process are listed below:
1. Information Procurement: This stage involved the procurement of Market data or related information via primary and secondary sources. The various secondary sources used included various company websites, annual reports, trade databases, and paid databases such as Hoover's, Bloomberg Business, Factiva, and Avention. Our team did 45 primary interactions Globally which included several stakeholders such as manufacturers, customers, key opinion leaders, etc. Overall, information procurement was one of the most extensive stages in our research process.
2. Information Analysis: This step involved triangulation of data through bottom-up and top-down approaches to estimate and validate the total size and future estimate of the Electronic Design Automation Market.
3. Report Formulation: The final step entailed the placement of data points in appropriate Market spaces in an attempt to deduce viable conclusions.
4. Validation & Publishing: Validation is the most important step in the process. Validation & re-validation via an intricately designed process helped us finalize data points to be used for final calculations. The final Market estimates and forecasts were then aligned and sent to our panel of industry experts for validation of data. Once the validation was done the report was sent to our Quality Assurance team to ensure adherence to style guides, consistency & design.
Customization Options
With the given market data, our dedicated team of analysts can offer you the following customization options are available for the Electronic Design Automation Market:
Product Analysis: Product matrix, which offers a detailed comparison of the product portfolio of companies.
Regional Analysis: Further analysis of the Electronic Design Automation Market for additional countries.
Competitive Analysis: Detailed analysis and profiling of additional Market players & comparative analysis of competitive products.
Go to Market Strategy: Find the high-growth channels to invest your marketing efforts and increase your customer base.
Innovation Mapping: Identify racial solutions and innovation, connected to deep ecosystems of innovators, start-ups, academics, and strategic partners.
Category Intelligence: Customized intelligence that is relevant to their supply Markets will enable them to make smarter sourcing decisions and improve their category management.
Public Company Transcript Analysis: To improve the investment performance by generating new alpha and making better-informed decisions.
Social Media Listening: To analyze the conversations and trends happening not just around your brand, but around your industry as a whole, and use those insights to make better Marketing decisions.
Our industry expert will work with you to provide you with customized data in a short amount of time.
REQUEST FREE CUSTOMIZATIONWant to customize this report? This report can be personalized according to your needs. Our analysts and industry experts will work directly with you to understand your requirements and provide you with customized data in a short amount of time. We offer $1000 worth of FREE customization at the time of purchase.

Report ID: SQMIG45E2189 | Region: Global | Published Date: Upcoming | Pages: 197 | Tables: 55 | Figures: 60
Global Application Development Software Market
Report ID: UCMIG45E2147 | Region: Global | Published Date: Upcoming | Pages: 165 | Tables: 55 | Figures: 60
Cryptocurrency Payment Apps Market
Report ID: SQMIG45E2120 | Region: Global | Published Date: Upcoming | Pages: 197 | Tables: 55 | Figures: 60
Global Talent Management Software Market
Report ID: UCMIG45E2161 | Region: Global | Published Date: Upcoming | Pages: 165 | Tables: 55 | Figures: 60
Cloud-based Apps Market
Product ID: UCMIG45E2191
 USA (+1) 351-333-4748
