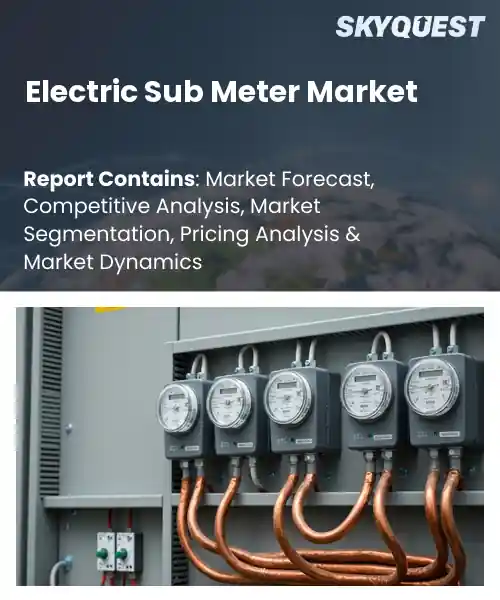
Electric Sub Meter Market
Report ID: SQMIG45J2668
Report ID: SQMIG45J2668
[email protected]
USA +1 351-333-4748
Report ID:
SQMIG45J2668 |
Region:
Global |
Published Date: July, 2026
Pages:
157
|Tables:
144
|Figures:
78


Global Electric Sub Meter Market size was valued at USD 7.32 Billion in 2024 and is poised to grow from USD 7.74 Billion in 2025 to USD 12.15 Billion by 2033, growing at a CAGR of 5.8% during the forecast period (2026-2033).
The global electric sub-meter market comprises devices installed after the main meter to allocate energy consumption to individual tenants, apartments, or equipment within a single property. This is important because multi-unit residential, commercial and industrial facilities are experiencing growing needs for accurate billing, energy saving incentives and regulatory compliance. The primary development driver for the electric sub meter market growth is the combination of advanced IoT connectivity and existing sustainability regulations across countries. With governments increasing their requirements for carbon reporting, building owners are seeking sub-meters that will provide real-time data to cloud platforms in order to automate demand-response and predictive maintenance. European office park installed sub-meters connected to an AI-based energy management system, qualifying the site for green-building certification rebates and reducing peak consumption by 15%. This cause-and-effect chain of legislation driving digital adoption, resulting in operational savings and new revenue streams, represents a significant market opportunity for manufacturers of interoperable, low-power sub-meter modules and related analytics services.
How is AI-driven IoT automation reshaping the electric sub‑meter market?
AI-powered IoT automation is turning electric submetering from a passive data collection activity into a proactive energy management engine. Sensors embedded in residential and business meters send real-time voltage, current and usage trends to cloud platforms, where machine-learning models spot anomalies, predict demand spikes and suggest load-shifting measures. Utilities can add price signals, send alarms for tampering, and push firmware updates remotely, without field trips. Operators are trying to cut non-technical losses, improve billing accuracy and let consumers monitor their usage on smartphones. Subscription analytics services are gaining in popularity. These capabilities are spurring the adoption of smart sub-metering in multi-tenant buildings and congested urban grids.
Market snapshot - (2026-2033)
Global Market Size
USD 7.32 Billion
Largest Segment
Single-Phase Sub Meters
Fastest Growth
Three-Phase Sub Meters
Growth Rate
5.8% CAGR
To get more insights on this market click here to Request a Free Sample Report
The global electric sub meter market is segmented by product type, technology, connectivity, application, end user and region. Based on product type, the market is segmented into Single-Phase Sub Meters and Three-Phase Sub Meters. Based on technology, the market is segmented into Electromechanical Sub Meters, Electronic/Digital Sub Meters and Smart Sub Meters. Based on connectivity, the market is segmented into Wired and Wireless. Based on application, the market is segmented into Residential, Commercial and Industrial. Based on end user, the market is segmented into Property Management Companies, Utilities, Industrial Facilities, Government & Public Infrastructure and Others. Based on region, the market is segmented into North America, Europe, Asia Pacific, Latin America and Middle East & Africa.
As per the electric sub meter market analysis, the Electronic/Digital Sub Meters category dominated the market owing to their accurate measurement and low maintenance requirements that enable property owners to ensure reliable billing and energy management. They are often used in residential and commercial installations due to their solid state components reducing mechanical wear and their integrated data logging to serve regulatory reporting requirements. Their ease of installation and interaction with existing building management systems makes them even more dominant in the market.
However, the fastest growth velocity in Smart Sub Meters is due to the use of advanced communication protocols and analytics that allow utilities to provide demand response programs and real-time usage alerts to customers. The growth of IoT ecosystems and the evolution of energy-saving regulations are driving their adoption. They’re a new revenue stream and a catalyst to the future growth of the market.
According to the electric sub meter market forecast, Wireless Connectivity is at the forefront of this industry, speeding up the implementation of projects, facilitating the process of installations in buildings with multiple apartments, and making complex wiring unnecessary. The prompt data transmission to cloud platforms makes it possible to monitor objects better and perform diagnostics online, thereby fulfilling the needs of communication operators in the scalability and flexibility of the solutions being used. The prevalence of this method both for residential buildings and for business is also manifested in the savings achieved through the use of wired solutions and the attractiveness of plug-and-play devices.
Meanwhile, one of the fastest-growing areas is wired connectivity whose reliability and high bandwidth capacities allow for industrial metering requiring precise measurements. The developments in Power over Ethernet and their standardization make it easier to integrate them into SCADA systems, so at this time vendors choose wired solutions in their operations.
To get detailed segments analysis, Request a Free Sample Report
As per the electric sub meter market regional forecast, leading -edge manufacturing skills, a focus on digital transformation, and a commitment to energy efficiency are a special blend in Asia Pacific’s industrial and urban settings. The region’s advanced techno-ecosystems facilitate rapid deployment of smart metering technologies in future grid architectures. Robust legislative frameworks for utilities and big commercial clients drive granular consumption monitoring. Strong economic argument exists for detailed sub-metering where population density is high. Such a joint study by government, business and academia promotes continuous innovation and makes the region a pioneer of intelligent energy management. These factors together provide the competitive advantage that keeps a country at the top of the world.
Japan electric submeter market
A well-developed manufacturing electric submeters industry in Japan is supported by experience in the field of precision electronics and sensor technology. A national agenda on robust grid operations and low carbon transition is driving the industry. Submetering is widely used for commercial and residential high-rise buildings to optimize energy consumption and meet stringent building codes. Utilities partner with digital companies to speed deployment of integrated systems that incorporate real-time monitoring and data analytics, cementing Japan's status as a leader in advanced energy management.
South Korea Electric Sub Meter Industry
The South Korean electric submeter sector is driven by a proactive regulatory environment encouraging the construction of smart grids and integration of renewable energy sources. The country has a strong ICT sector that also provides modern communication protocols improving data security and meter interoperability. Cost transparency and operational efficiency are enabled by sub-metering in industrial parks and mixed-use projects. The public and commercial sectors are working together to develop next generation metering systems to promote South Korea’s competitive edge and contribute to the national goals of digital innovation and energy conservation.
Europe is growing fast on the back of advanced energy performance regulations, ambitious climate targets and a mature digital infrastructure sector. With the region’s focus on decarbonization, utilities and property owners are demanding precision in consumption insights through submetering. Good cooperation between technology vendors, standards organizations and regulatory bodies ensures smooth integration across the different grid systems. Adoption is also being driven by the rise of data-driven energy services and demand for sustainable construction certifications. The market is growing in Europe, due to smart city projects and international energy initiatives, and creating an ecosystem where granular measurement is increasingly important to hit policy goals and optimize resources.
German Electric Submeters Market
The German electric sub meter market benefits from strong engineering traditions and a well-established regulatory framework that requires comprehensive energy reporting. Sub-metering is used to achieve national efficiency targets in high performance residential sectors and large industrial complexes. Next-generation data platforms allow to do real-time analytics for proactive demand management and cost savings. As they work together, utilities, IT companies and research centers are constantly creating new products and services. Germany is thus a leading market for sophisticated energy monitoring.
UK Electric Sub Meter Market
The UK’s electric submeter market is growing quickly, due to aggressive government incentives and a booming fintech ecosystem that supports services around energy data. In commercial real estate and mixed-use developments, submetering is being used to improve tenant engagement and achieve sustainability goals. It is based on open-standard communication protocols to allow existing and legacy grid components to work together seamlessly. Strong consumer empowerment and open billing are fueling demand for granular measurement in the UK, a significant growth engine in Europe.
France Electric Sub Meter Market
Smart energy management is becoming popular in the French electric submeter industry. National sustainability agendas encourage the implementation of these systems in public infrastructure and residential dwellings in order to reduce overall consumption. The market employs cooperative pilots that feature demand-response plans, renewable energy integration, and submetering. Utilities and property managers looking to improve operational efficiency are attracted to French tech companies due to their strong data security and well-known user-friendly interfaces. This acceleration makes France now a major player in the enlargement of the European scene.
North America’s position is reinforced by a combination of strong utility modernization programs, large investments in Internet of Things ecosystems, and a culture of data-driven decision making. Across the region, utilities are rolling out sub-metering solutions at scale in the commercial and multifamily sectors, with a focus on grid resilience and customer engagement. Having top technological pioneers in the field speeds up the development of scalable platforms to integrate metering data with analytics and predictive maintenance tools. Cooperative standards development and regulatory incentives further facilitate seamless adoption. With the region’s focus on sustainability and operational effectiveness, the market is charting a forward-looking trajectory.
U.S. Electric Sub Meter Market
Massive utility infrastructure upgrades and the growing market for smart building technologies are fueling the US electric sub meter market. Sub-metering allows large residential communities and commercial campuses to implement energy-saving measures and offer cost transparency. The market is supported by a strong ecosystem of technology providers who provide cloud-based analytics and seamless integration with building management systems. Supporting policy frameworks for dynamic situations promote energy efficiency and consumer empowerment, with submetering an important part of operational strategy.
Canada Electric Sub Metering Market
The electric submeter market penetration in Canada is expanding because of a combination of regional utility efforts to modernize the grid, and government sustainability objectives. Both residential and commercial establishments use accurate measurement to maximize the use of electricity and heating due to cold climate variables. Canadian industry and research institutions work together to develop metering systems that are rugged and designed for the Canadian marketplace. The increasing emphasis on data security, interoperability and renewable integration is creating an environment where sub-metering is becoming essential to meeting national energy goals.
To know more about the market opportunities by region and country, click here to
Buy The Complete Report
Regulatory Support Drives Adoption
IoT Connectivity Improves Data Accessibility
High Installation Costs Limit Adoption
Regulatory Variability Creates Uncertainty
Request Free Customization of this report to help us to meet your business objectives.
The electric sub-meter industry is experiencing intense global competition with established players competing for strategic mergers and acquisitions, joint ventures and launch of technology-driven products. Landis+Gyr’s acquisition of Itron’s smart-meter division expands its portfolio and market reach, pressuring competitors to innovate and consolidate, while Schneider Electric’s recent collaboration with Siemens to co-develop interoperable sub-metering platforms accelerates standardization.
Top Player’s Company Profile
Recent Developments in the Electric Sub Meter Market
In June 2025, Schneider Electric announced the launch of a cloud-enabled smart sub-metering system that integrates with its EcoStruxure platform to provide automated demand response, real-time energy analytics and remote firmware updates for residential and commercial buildings. The system is designed for seamless interchange with existing electrical infrastructure, with many utility partners around the world, modular hardware, and cybersecurity.
In January 2025, Landis+Gyr Group AG launched an enhanced sub-metering technology that offers cloud analytics and wireless connectivity, aimed at big residential buildings. The solution offers utilities and end users granular consumption data, features plug-and-play installation, dynamic tariff management and integrates with smart home ecosystems to enhance transparency and support sustainability goals.
SkyQuest’s ABIRAW (Advanced Business Intelligence, Research & Analysis Wing) is our Business Information Services team that Collects, Collates, Correlates, and Analyses the Data collected by means of Primary Exploratory Research backed by robust Secondary Desk research.
As per SkyQuest analysis, strong regulatory support for correct energy reporting is the major driving factor for the global electric submeter market. The second factor turning raw meter data into useful real-time energy management insights is the rise of AI-powered IoT automation. The most important barrier, especially to the uptake of retrofits, is the high upfront cost of installation. Asia Pacific holds the largest market share. Dense urbanisation and proactive policy frameworks primarily drive demand. The main products on the market are electronic/digital submeters, which confirm their leadership in residential and commercial applications with precision, easy maintenance and perfect integration with building-management systems.
| Report Metric | Details |
|---|---|
| Market size value in 2024 | USD 7.32 Billion |
| Market size value in 2033 | USD 1596.0 Billion |
| Growth Rate | 5.8% |
| Base year | 2024 |
| Forecast period | (2026-2033) |
| Forecast Unit (Value) | USD Billion |
| Segments covered |
|
| Regions covered | North America (US, Canada), Europe (Germany, France, United Kingdom, Italy, Spain, Rest of Europe), Asia Pacific (China, India, Japan, Rest of Asia-Pacific), Latin America (Brazil, Rest of Latin America), Middle East & Africa (South Africa, GCC Countries, Rest of MEA) |
| Companies covered |
|
| Customization scope | Free report customization with purchase. Customization includes:-
|
To get a free trial access to our platform which is a one stop solution for all your data requirements for quicker decision making. This platform allows you to compare markets, competitors who are prominent in the market, and mega trends that are influencing the dynamics in the market. Also, get access to detailed SkyQuest exclusive matrix.
Table Of Content
Executive Summary
Market overview
Parent Market Analysis
Market overview
Market size
KEY MARKET INSIGHTS
COVID IMPACT
MARKET DYNAMICS & OUTLOOK
Market Size by Region
KEY COMPANY PROFILES
Methodology
For the Electric Sub Meter Market, our research methodology involved a mixture of primary and secondary data sources. Key steps involved in the research process are listed below:
1. Information Procurement: This stage involved the procurement of Market data or related information via primary and secondary sources. The various secondary sources used included various company websites, annual reports, trade databases, and paid databases such as Hoover's, Bloomberg Business, Factiva, and Avention. Our team did 45 primary interactions Globally which included several stakeholders such as manufacturers, customers, key opinion leaders, etc. Overall, information procurement was one of the most extensive stages in our research process.
2. Information Analysis: This step involved triangulation of data through bottom-up and top-down approaches to estimate and validate the total size and future estimate of the Electric Sub Meter Market.
3. Report Formulation: The final step entailed the placement of data points in appropriate Market spaces in an attempt to deduce viable conclusions.
4. Validation & Publishing: Validation is the most important step in the process. Validation & re-validation via an intricately designed process helped us finalize data points to be used for final calculations. The final Market estimates and forecasts were then aligned and sent to our panel of industry experts for validation of data. Once the validation was done the report was sent to our Quality Assurance team to ensure adherence to style guides, consistency & design.
Analyst Support
Customization Options
With the given market data, our dedicated team of analysts can offer you the following customization options are available for the Electric Sub Meter Market:
Product Analysis: Product matrix, which offers a detailed comparison of the product portfolio of companies.
Regional Analysis: Further analysis of the Electric Sub Meter Market for additional countries.
Competitive Analysis: Detailed analysis and profiling of additional Market players & comparative analysis of competitive products.
Go to Market Strategy: Find the high-growth channels to invest your marketing efforts and increase your customer base.
Innovation Mapping: Identify racial solutions and innovation, connected to deep ecosystems of innovators, start-ups, academics, and strategic partners.
Category Intelligence: Customized intelligence that is relevant to their supply Markets will enable them to make smarter sourcing decisions and improve their category management.
Public Company Transcript Analysis: To improve the investment performance by generating new alpha and making better-informed decisions.
Social Media Listening: To analyze the conversations and trends happening not just around your brand, but around your industry as a whole, and use those insights to make better Marketing decisions.
REQUEST FOR SAMPLE
 REQUEST FREE CUSTOMIZATION
Global Electric Sub Meter Market size was valued at USD 7.32 Billion in 2024 and is poised to grow from USD 7.74 Billion in 2025 to USD 1596.0 Billion by 2033, growing at a CAGR of 5.8% during the forecast period (2026-2033).
The global electric sub‑meter market is shaped by intense competition as incumbents pursue strategic M&A, joint ventures and technology‑driven product rollouts; Schneider Electric’s recent partnership with Siemens to co‑develop interoperable sub‑metering platforms accelerates standardisation, while Landis+Gyr’s acquisition of Itron’s smart‑meter division expands its portfolio and market reach, intensifying pressure on rivals to innovate and consolidate. 'Schneider Electric SE', 'Siemens AG', 'Honeywell International Inc', 'Eaton Corporation', 'Leviton Manufacturing Co Inc', 'Landis+Gyr Group AG', 'Itron Inc', 'E-Mon', 'Kamstrup A/S', 'Socomec Group', 'Carlo Gavazzi Holding AG', 'Chint Group Co Ltd', 'Wasion Holdings Limited', 'Hexing Electrical Co Ltd', 'Genus Power Infrastructures Ltd', 'HPL Electric & Power Limited', 'Secure Meters Limited', 'Accuenergy Ltd', 'Dent Instruments Inc', 'Obvius LLC'
Smart Grid Integration: Utilities and large commercial facilities are increasingly adopting electric sub meters to support smart grid initiatives. By providing granular consumption data, sub meters enable utilities to balance load, manage demand response programs, and improve outage detection. The ability to remotely configure and monitor meters reduces the need for field visits, enhancing operational efficiency. As grid operators seek more resilient and flexible networks, the demand for interoperable sub metering solutions that seamlessly exchange data with advanced distribution management systems is growing
Why does Asia Pacific Dominate the Global Electric Sub Meter Market? |@12


Want to customize this report? This report can be personalized according to your needs. Our analysts and industry experts will work directly with you to understand your requirements and provide you with customized data in a short amount of time. We offer $1000 worth of FREE customization at the time of purchase.
Feedback From Our Clients


 USA (+1) 351-333-4748

