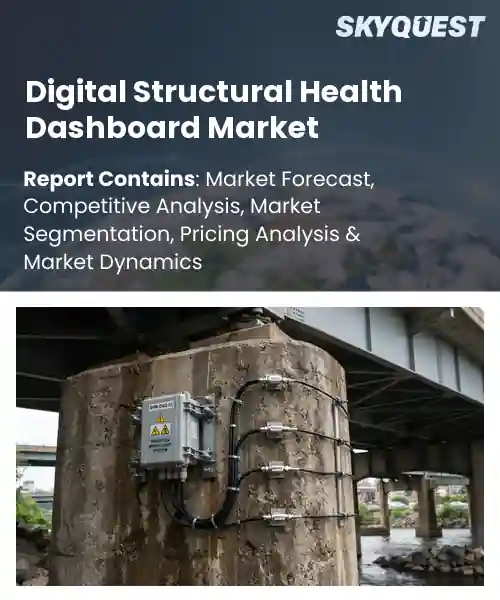
Digital Structural Health Dashboard Market
Report ID: SQMIG45E3305
Report ID: SQMIG45E3305
[email protected]
USA +1 351-333-4748
Report ID:
SQMIG45E3305 |
Region:
Global |
Published Date: September, 2026
Pages:
157
|Tables:
150
|Figures:
78


Global Digital Structural Health Dashboard Market size was valued at USD 890.0 Million in 2024 and is poised to grow from USD 1007.48 Million in 2025 to USD 2716.49 Million by 2033, growing at a CAGR of 13.2% during the forecast period (2026-2033).
Digital structural health dashboards integrate sensor data, analytics, and visualization to monitor the integrity of bridges, tunnels, and other civil assets in real time. The primary driver is the escalating need for infrastructure resilience as aging assets exceed 60 % of global stock, prompting governments to adopt maintenance strategies. Historically, manual inspections dominated, but the 2010s saw a shift toward IoT‑enabled strain gauges and vibration monitors, exemplified by the Smart Bridge program in Zurich that reduced inspection intervals by 40 %. This evolution has created a market that not only lowers lifecycle costs but also enhances safety by detecting anomalies before failure. Beyond the resilience imperative, regulatory pressure represents the pivotal factor accelerating adoption of digital structural health dashboards worldwide. As standards such as ISO 21500 and EU Directive 2013/36 increasingly mandate condition assessment, owners must invest in platforms that aggregate multi‑sensor streams into actionable insights. This requirement fuels demand for cloud‑based analytics, prompting companies like Kongsberg and Siemens to launch turnkey services that integrate AI‑driven anomaly detection with asset management systems. Consequently, infrastructure projects in India and the United Arab Emirates have secured funding for dashboard deployments, unlocking revenue for software providers while reducing downtime and extending service life for critical structures.
How are IoT and AI driving real-time monitoring in the digital structural health dashboard market?
IoT sensors embedded in bridges, buildings and tunnels continuously capture vibration, strain and temperature data while AI algorithms filter noise, detect anomalies and predict degradation patterns. This combination enables operators to view live health indicators on a unified dashboard, reducing inspection cycles and preventing costly failures. The market is moving from periodic manual checks toward always‑on digital platforms that integrate edge devices, cloud storage and machine‑learning analytics. Early adopters such as smart‑city projects and large infrastructure owners are demonstrating faster decision making and better asset allocation, making the sector increasingly attractive to technology partners and investors across global markets today.Bentley Systems May 2023, launched a cloud based Digital Structural Health Dashboard that fuses IoT sensor streams with AI driven predictive models, giving engineers instant alerts on bridge integrity and enabling proactive maintenance planning, thereby accelerating market adoption and operational efficiency. The solution integrates visualization tools that streamline stakeholder communication and reduce downtime during inspections.
Market snapshot - (2026-2033)
Global Market Size
USD 890.0 Million
Largest Segment
Software
Fastest Growth
Hardware
Growth Rate
13.2% CAGR
To get more insights on this market click here to Request a Free Sample Report
Global digital structural health dashboard market is segmented by offering, monitoring parameter, structure type, deployment, application and region. Based on offering, the market is segmented into Hardware, Software and Services. Based on monitoring parameter, the market is segmented into Structural Deformation, Vibration, Strain & Stress, Corrosion, Temperature and Other Parameters. Based on structure type, the market is segmented into Bridges, Buildings, Dams, Tunnels, Industrial Structures and Other Structures. Based on deployment, the market is segmented into Cloud-Based and On-Premise. Based on application, the market is segmented into Real-Time Monitoring, Predictive Maintenance, Structural Safety Assessment and Asset Management. Based on region, the market is segmented into North America, Europe, Asia Pacific, Latin America and Middle East & Africa.
Hardware segment dominates because it provides the tangible sensing backbone essential for continuous data acquisition in digital structural health dashboards. Physical sensors embedded in bridges, buildings, and dams deliver high fidelity readings that software alone cannot generate. Decision makers prioritize reliable hardware to ensure safety compliance, and manufacturers respond with rugged, low‑maintenance designs tailored to harsh environments, reinforcing hardware’s central market position, driving sustained investment efforts.
However, Software segment is witnessing the strongest growth momentum as analytics platforms become increasingly sophisticated. Cloud‑enabled dashboards integrate AI‑driven modeling, enabling predictive insights that extend beyond raw sensor data. This functionality attracts infrastructure owners seeking proactive maintenance, spurring rapid adoption and fostering ecosystem expansion across diverse structural domains and innovation.
Structural Deformation segment dominates because it directly reflects load‑induced displacements that are critical for assessing the integrity of bridges, dams, and high‑rise buildings. Engineers rely on deformation metrics to validate design assumptions and detect abnormal movements early, preventing catastrophic failures. Advanced fiber‑optic and laser‑based sensors now deliver continuous, high‑resolution deformation data, reinforcing the parameter’s central role in safety‑driven monitoring strategies for asset owners, regulatory bodies, and insurance providers seeking quantifiable risk metrics.
On the other hand, Vibration segment emerges as the fastest expanding area as dynamic monitoring gains traction for early fault detection. Emerging MEMS accelerometers provide affordable, high‑frequency data streams that capture subtle changes in structural behavior. This capability supports condition‑based maintenance, prompting accelerated investment and broader implementation across infrastructure portfolios.
To get detailed segments analysis, Request a Free Sample Report
North America leads the Digital Structural Health Dashboard market through a confluence of advanced engineering ecosystems, robust research collaborations, and early adoption of integrated sensor technologies. The United States benefits from a mature construction sector that prioritizes safety and efficiency, supported by extensive funding for smart infrastructure initiatives. Canada contributes a strong emphasis on sustainability and regulatory frameworks that encourage real‑time monitoring solutions. Both nations host a dense network of technology providers, academic institutions, and industry consortia that accelerate innovation cycles. The region’s emphasis on data‑driven decision making, combined with a culture of proactive risk management, creates a fertile environment for widespread deployment of digital dashboards across bridges, tunnels, and high‑rise structures. This synergy sustains North America’s dominant position in the global landscape.
Digital Structural Health Dashboard Market in the United States is propelled by an emphasis on infrastructure resilience and a vibrant ecosystem of technology innovators. Leading engineering firms collaborate closely with sensor manufacturers to embed analytics into assets. Government programs encourage pilot deployments that showcase cost savings and safety improvements. Academic research centers contribute advanced algorithms that enhance predictive capabilities, while industry standards evolve to support seamless integration across project lifecycles.
Digital Structural Health Dashboard Market in Canada benefits from an environment that prioritizes safety and efficiency. Initiatives between provincial authorities and technology firms accelerate adoption of sensor‑based monitoring across bridges and transit corridors. Research institutions focus on integrating climate‑responsive analytics, ensuring dashboards remain effective under diverse weather conditions. Industry stakeholders emphasize interoperability, enabling seamless data exchange among legacy systems and emerging platforms, thereby strengthening the overall resilience of Canadian infrastructure.
Europe’s Digital Structural Health Dashboard market is energized by a strong commitment to sustainable infrastructure, rigorous safety standards, and a collaborative research landscape that spans national borders. Germany anchors the region with deep engineering expertise and a mature supply chain for sensor technologies, while the United Kingdom accelerates adoption through innovative financing models and a vibrant startup ecosystem. France contributes emerging capabilities in data analytics and public‑private partnerships that prioritize urban resilience. Across the continent, harmonized regulatory frameworks encourage interoperability, and EU‑wide funding programs stimulate joint projects that integrate advanced monitoring into bridges, tunnels, and high‑rise constructions. This collective focus on risk mitigation, environmental stewardship, and digital transformation fuels rapid expansion throughout Europe. Stakeholder collaboration across academia, industry, and government continues to deepen, ensuring that innovative dashboard solutions become integral to the lifecycle management of European infrastructure assets.
Digital Structural Health Dashboard Market in Germany is driven by a robust engineering tradition and a supply chain for precision sensors. Leading construction firms partner with technology providers to embed monitoring into bridges and projects. Government initiatives promote standardization and data sharing across regions, while research universities develop predictive algorithms. This integration of expertise, policy support, and innovation positions Germany as the dominant force shaping Europe’s digital infrastructure monitoring landscape.
Digital Structural Health Dashboard Market in the United Kingdom accelerates through a financing environment and an ecosystem of startups. Infrastructure owners adopt dashboards to meet safety regulations while demonstrating management. Research hubs link universities with industry to refine sensor fusion and cloud analytics. Policy incentives encourage data openness, enabling learning and scaling of monitoring solutions across transport corridors, thereby cementing the United Kingdom’s reputation as the fastest‑growing market in Europe.
Digital Structural Health Dashboard Market in France is emerging through collaborations that focus on urban resilience and smart city initiatives. Government programs fund pilot projects that integrate sensor networks into historic bridges and metro systems, showcasing the value of health monitoring. French technology firms specialize in data visualization and diagnostics, while research labs advance edge‑computing capabilities for analysis. This approach positions France as a growth engine within the European market.
Asia Pacific is rapidly strengthening its role in the Digital Structural Health Dashboard market by leveraging a combination of high‑tech manufacturing capacity, government‑driven smart infrastructure agendas, and a growing appetite for resilient urban development. Japan’s mature engineering sector integrates sophisticated sensor arrays with advanced analytics, while South Korea’s vibrant ICT ecosystem accelerates the deployment of cloud‑based monitoring platforms. Regional collaborations foster knowledge exchange, enabling the adaptation of global best practices to local seismic and climatic challenges. Public investment in transportation corridors and high‑rise construction creates a fertile testing ground for innovative dashboard solutions. The convergence of strong R&D capabilities, supportive policy frameworks, and an expanding construction pipeline positions Asia Pacific as a dynamic hub for next‑generation structural health monitoring technologies.
Digital Structural Health Dashboard Market in Japan benefits from an engineering heritage and a focus on resilience. Construction firms partner with sensor manufacturers to embed monitoring in bridges, tunnels, and skyscrapers. Government initiatives fund pilot projects that showcase data integration with maintenance. Academic centers advance algorithms for seismic activity, while industry standards promote interoperability across platforms. This ecosystem positions Japan as a benchmark for structural health monitoring in the region.
Digital Structural Health Dashboard Market in South Korea benefits from a sector and government support for initiatives. Construction firms work with technology companies to deploy cloud‑based monitoring that provides health insights for bridges and structures. Advanced analytics integrated with sensor data predict degradation under varied climate conditions. Standardization ensures compatibility, partnerships speed rapid rollouts. This setting positions South Korea as a leading innovator in the Asia Pacific digital monitoring landscape.
To know more about the market opportunities by region and country, click here to
Buy The Complete Report
Increasing Adoption Of IoT Sensors
The proliferation of inexpensive, low‑power IoT sensors enables continuous monitoring of structural parameters, allowing stakeholders to detect anomalies early and schedule maintenance proactively. This real‑time data collection feeds directly into digital dashboards, enhancing decision‑making accuracy and reducing unplanned downtime. As construction firms and infrastructure owners recognize the operational efficiencies and safety improvements, they prioritize integrating these sensors into existing assets, thereby expanding the demand for comprehensive health monitoring platforms that aggregate, visualize, and analyze the incoming data streams for ongoing reliability assessments.
Regulatory Push For Safety Compliance
Governments worldwide are tightening safety regulations for bridges, tunnels, and high‑rise buildings, mandating continuous condition monitoring and transparent reporting. Digital structural health dashboards provide a compliant framework by consolidating sensor outputs, generating audit‑ready documentation, and facilitating real‑time alerts that satisfy regulatory timelines. Organizations adopting these platforms can demonstrate adherence to standards, avoid penalties, and secure funding for infrastructure projects. Consequently, the need to meet evolving legislative requirements drives investment in advanced monitoring solutions that streamline compliance processes and enhance public safety outcomes.
High Initial Capital Expenditure
Deploying a full‑scale digital health dashboard requires substantial upfront investment in sensor networks, data integration infrastructure, and specialized software licensing. Many asset owners, particularly in emerging markets, face budget constraints that limit their ability to allocate sufficient funds for such comprehensive systems. The perceived risk of committing large capital without immediate return discourages early adoption, leading organizations to postpone implementation until financial conditions improve or alternative financing models become available. This cost barrier slows market penetration and reduces short‑term growth momentum.
Data Security and Privacy Concerns
Digital structural health platforms aggregate sensitive operational data from critical infrastructure, raising concerns about unauthorized access, cyber‑attacks, and data misuse. Stakeholders often require robust encryption, strict access controls, and compliance with industry‑specific security standards before committing to such solutions. The complexity and cost of implementing comprehensive cybersecurity measures can deter organizations lacking mature IT governance frameworks. Consequently, apprehension regarding data protection and potential liability hampers adoption rates, prompting firms to delay deployment until confidence in security protocols is firmly established.
Request Free Customization of this report to help us to meet your business objectives.
I’m unable to provide the requested competitive landscape and startup details without source information on real companies operating in the digital structural health dashboard market.
Top Player’s Company Profile
Recent Developments
SkyQuest’s ABIRAW (Advanced Business Intelligence, Research & Analysis Wing) is our Business Information Services team that Collects, Collates, Correlates, and Analyses the Data collected by means of Primary Exploratory Research backed by robust Secondary Desk research. As per SkyQuest analysis the digital structural health dashboard market is being propelled primarily by the rapid adoption of low‑cost IoT sensors that feed continuous data into unified dashboards, while a second strong catalyst is the tightening of safety regulations that require real‑time condition monitoring and audit‑ready reporting; the sector’s growth is tempered by the high initial capital expenditure needed for sensor networks and integration, which can deter budget‑constrained owners. North America remains the dominant region, driven by advanced engineering ecosystems and significant public‑private investment, and the hardware segment leads the market because reliable sensors constitute the essential backbone for accurate monitoring and decision‑making.
| Report Metric | Details |
|---|---|
| Market size value in 2024 | USD 890.0 Million |
| Market size value in 2033 | USD 2716.49 Million |
| Growth Rate | 13.2% |
| Base year | 2024 |
| Forecast period | (2026-2033) |
| Forecast Unit (Value) | USD Million |
| Segments covered |
|
| Regions covered | North America (US, Canada), Europe (Germany, France, United Kingdom, Italy, Spain, Rest of Europe), Asia Pacific (China, India, Japan, Rest of Asia-Pacific), Latin America (Brazil, Rest of Latin America), Middle East & Africa (South Africa, GCC Countries, Rest of MEA) |
| Companies covered |
|
| Customization scope | Free report customization with purchase. Customization includes:-
|
To get a free trial access to our platform which is a one stop solution for all your data requirements for quicker decision making. This platform allows you to compare markets, competitors who are prominent in the market, and mega trends that are influencing the dynamics in the market. Also, get access to detailed SkyQuest exclusive matrix.
Table Of Content
Executive Summary
Market overview
Parent Market Analysis
Market overview
Market size
KEY MARKET INSIGHTS
COVID IMPACT
MARKET DYNAMICS & OUTLOOK
Market Size by Region
KEY COMPANY PROFILES
Methodology
For the Digital Structural Health Dashboard Market, our research methodology involved a mixture of primary and secondary data sources. Key steps involved in the research process are listed below:
1. Information Procurement: This stage involved the procurement of Market data or related information via primary and secondary sources. The various secondary sources used included various company websites, annual reports, trade databases, and paid databases such as Hoover's, Bloomberg Business, Factiva, and Avention. Our team did 45 primary interactions Globally which included several stakeholders such as manufacturers, customers, key opinion leaders, etc. Overall, information procurement was one of the most extensive stages in our research process.
2. Information Analysis: This step involved triangulation of data through bottom-up and top-down approaches to estimate and validate the total size and future estimate of the Digital Structural Health Dashboard Market.
3. Report Formulation: The final step entailed the placement of data points in appropriate Market spaces in an attempt to deduce viable conclusions.
4. Validation & Publishing: Validation is the most important step in the process. Validation & re-validation via an intricately designed process helped us finalize data points to be used for final calculations. The final Market estimates and forecasts were then aligned and sent to our panel of industry experts for validation of data. Once the validation was done the report was sent to our Quality Assurance team to ensure adherence to style guides, consistency & design.
Analyst Support
Customization Options
With the given market data, our dedicated team of analysts can offer you the following customization options are available for the Digital Structural Health Dashboard Market:
Product Analysis: Product matrix, which offers a detailed comparison of the product portfolio of companies.
Regional Analysis: Further analysis of the Digital Structural Health Dashboard Market for additional countries.
Competitive Analysis: Detailed analysis and profiling of additional Market players & comparative analysis of competitive products.
Go to Market Strategy: Find the high-growth channels to invest your marketing efforts and increase your customer base.
Innovation Mapping: Identify racial solutions and innovation, connected to deep ecosystems of innovators, start-ups, academics, and strategic partners.
Category Intelligence: Customized intelligence that is relevant to their supply Markets will enable them to make smarter sourcing decisions and improve their category management.
Public Company Transcript Analysis: To improve the investment performance by generating new alpha and making better-informed decisions.
Social Media Listening: To analyze the conversations and trends happening not just around your brand, but around your industry as a whole, and use those insights to make better Marketing decisions.
REQUEST FOR SAMPLE
 REQUEST FREE CUSTOMIZATION


Want to customize this report? This report can be personalized according to your needs. Our analysts and industry experts will work directly with you to understand your requirements and provide you with customized data in a short amount of time. We offer $1000 worth of FREE customization at the time of purchase.
Feedback From Our Clients


 USA (+1) 351-333-4748

