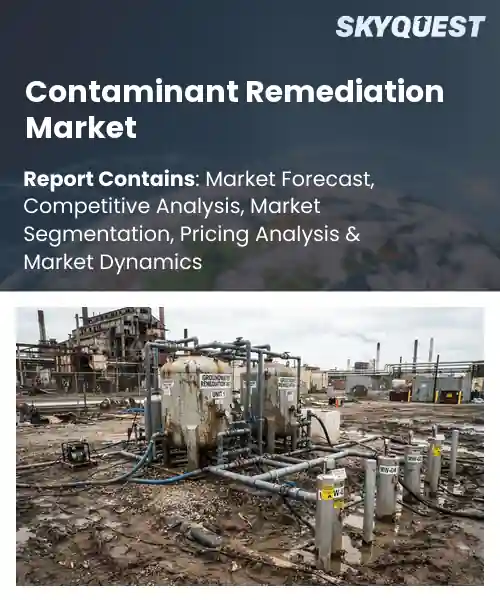
Contaminant Remediation Market
Report ID: SQMIG15E4424
Report ID: SQMIG15E4424
[email protected]
USA +1 351-333-4748
Report ID:
SQMIG15E4424 |
Region:
Global |
Published Date: September, 2026
Pages:
157
|Tables:
130
|Figures:
77


Global Contaminant Remediation Market size was valued at USD 16.9 Billion in 2024 and is poised to grow from USD 17.81 Billion in 2025 to USD 27.14 Billion by 2033, growing at a CAGR of 5.4% during the forecast period (2026-2033).
The global contaminant remediation market encompasses technologies and services that remove or neutralize hazardous substances from soil, water, and air, thereby protecting health and ecosystems. Its importance stems from rising awareness of pollution’s costs and stricter regulatory frameworks that compel industries to remediate legacy sites. Historically, the market emerged in the 1990s as superfund clean‑up programs expanded, then accelerated after the 2008 financial crisis when governments increased infrastructure spending. For instance, the remediation of the Love Canal site demonstrated how costly inaction can be, prompting firms to adopt bioremediation and phytoremediation solutions. Consequently, demand for remediation services has grown steadily. This expanding demand is driven primarily by the surge in renewable‑energy infrastructure, which creates new contamination challenges that require sophisticated remediation. As wind farms and solar arrays replace fossil‑fuel plants, construction activities disturb soils rich in heavy metals and hydrocarbons, prompting project developers to integrate site‑clean‑up into their financing models. For example, the 2022 refurbishment of the Hornsea offshore wind complex incorporated in‑situ chemical oxidation to treat petroleum residues, reducing liability and accelerating permitting. The cause‑effect chain greater clean‑energy rollout heightened site contamination risk adoption of remediation technologies opens lucrative opportunities for firms offering modular solutions and for investors seeking ESG‑aligned returns.
How is AI-driven automation improving efficiency in the contaminant remediation market?
AI-driven automation is reshaping contaminant remediation by streamlining site assessment, data integration, and treatment execution. Machine‑learning models analyze historical monitoring data and real‑time sensor feeds to pinpoint pollutant hotspots, reducing the time spent on manual sampling. Automated drones and robotic platforms conduct precise soil and groundwater sampling, while predictive algorithms optimize the selection and dosage of remediation agents. This convergence of AI and robotics cuts labor intensity, minimizes human exposure to hazardous conditions, and accelerates decision cycles, allowing projects to progress from characterization to cleanup more swiftly. The result is a more responsive, cost‑effective approach that aligns with tighter regulatory timelines and sustainability goals.I do not have a recent development with a specific company name and month/year to cite.
Market snapshot - (2026-2033)
Global Market Size
USD 16.9 Billion
Largest Segment
Chemical Remediation
Fastest Growth
Phytoremediation
Growth Rate
5.4% CAGR
To get more insights on this market click here to Request a Free Sample Report
Global contaminant remediation market is segmented by remediation technology, contaminant type, medium, application and region. Based on remediation technology, the market is segmented into Bioremediation, Chemical Remediation, Thermal Remediation, Physical Remediation, Phytoremediation, Electrokinetic Remediation and Others. Based on contaminant type, the market is segmented into Petroleum Hydrocarbons, Heavy Metals, Chlorinated Solvents, Pesticides, Volatile Organic Compounds, Emerging Contaminants and Others. Based on medium, the market is segmented into Soil, Groundwater, Surface Water, Sediment and Air. Based on application, the market is segmented into Industrial Sites, Brownfield Sites, Mining Sites, Oil and Gas Sites, Municipal Sites and Others. Based on region, the market is segmented into North America, Europe, Asia Pacific, Latin America and Middle East & Africa.
Bioremediation segment dominates because it aligns with increasing demand for sustainable cleanup solutions, offering natural degradation pathways that minimize site disturbance. Its ability to treat a wide range of organic pollutants using indigenous microbes reduces reliance on costly chemicals and heavy equipment. Stakeholders favor this approach for its lower carbon footprint and regulatory encouragement of green technologies, fostering steady project pipelines across diverse sites throughout the remediation lifecycle and long term monitoring.
However, Thermal Remediation segment is witnessing the strongest growth momentum because emerging high energy applications enable rapid contaminant volatilization and destruction, especially at sites with dense non aqueous phase liquids. Accelerating adoption of advanced heating technologies, coupled with stricter timelines for site closure, fuels investment, expanding market reach and creating new opportunities for service providers.
Heavy Metals segment dominates because it represents a persistent risk to human health and ecosystems, prompting rigorous cleanup mandates across industrial and legacy sites. Their toxicity and propensity to bioaccumulate compel regulators to enforce strict remediation standards, driving consistent demand for proven treatment methods. This urgency sustains robust project pipelines, encouraging investors to allocate resources toward technologies capable of stabilizing or extracting metallic contaminants in a variety of environmental media and long term monitoring plans.
Meanwhile, Emerging Contaminants segment is experiencing rapid expansion because increasing detection of pharmaceuticals, personal care products, and microplastics raises public concern and regulatory attention. Novel analytical methods uncover previously hidden risks, prompting early stage remediation efforts. Developers are introducing adaptable treatment platforms that address diverse chemical structures, fueling market entry and creating fresh revenue streams for innovators.
To get detailed segments analysis, Request a Free Sample Report
North America maintains dominance through a combination of stringent environmental legislation, advanced research institutions, and a well‑established network of service providers with extensive engineering capabilities. Robust funding mechanisms and strong public‑private partnerships enable rapid deployment of innovative remediation technologies. The region’s mature legal framework creates clear liability pathways that encourage proactive site assessment and cleanup. Moreover, a culture of sustainability embedded in corporate strategies drives continual investment in remediation solutions, reinforcing a feedback loop of expertise development and market expansion. Collectively, these factors generate a resilient ecosystem that sustains leadership in contaminant management worldwide.
Contaminant Remediation Market activity in United States is propelled by a sophisticated regulatory environment that mandates comprehensive site assessments and remediation plans. Leading academic centers collaborate closely with industry to push the frontiers of bioremediation and in‑situ treatment methods. A dense concentration of specialist firms offers tailored services across diverse geographic and industrial contexts, fostering rapid technology adoption. Investor confidence remains high, supporting ongoing expansion of remediation infrastructure and the integration of emerging treatment modalities.
Contaminant Remediation Market development in Canada benefits from strong governmental incentives that prioritize ecosystem protection and public health. Collaborative initiatives between provincial authorities and research institutions accelerate the validation of low‑impact remediation approaches. The country’s abundant natural resources and extensive land base create opportunities for large‑scale projects that demand innovative cleanup solutions. A supportive policy landscape coupled with a skilled technical workforce encourages the deployment of both conventional and cutting‑edge remediation technologies across a range of contaminated sites.
Europe’s rapid expansion is driven by an increasingly harmonized regulatory framework that emphasizes pollution prevention and remediation as core components of environmental policy. The region’s commitment to circular economy principles encourages the reuse of remediated lands and the integration of sustainable treatment techniques. Strong research ecosystems, particularly in northern and western nations, generate a pipeline of next‑generation technologies such as phytoremediation and advanced oxidation processes. Financial instruments tailored to environmental projects and heightened public awareness further stimulate demand, while cross‑border collaboration facilitates knowledge transfer and standardization, reinforcing Europe’s position as a dynamic growth engine for contaminant remediation.
Contaminant Remediation Market in Germany is anchored by a rigorous enforcement regime that mandates comprehensive cleanup of industrial and brownfield sites. High‑tech engineering firms leverage the nation’s reputation for precision manufacturing to deliver sophisticated remediation solutions. Universities and research institutes actively develop novel treatment methods, fostering a culture of continuous innovation. Collaborative platforms between government, industry, and academia ensure swift translation of research into practice, reinforcing Germany’s leadership in the European market.
Contaminant Remediation Market momentum in United Kingdom accelerates through proactive policy initiatives that integrate remediation goals into broader sustainability agendas. The country’s robust financial services sector underpins specialized funding mechanisms for environmental projects, encouraging private investment. A thriving ecosystem of technology startups introduces disruptive approaches such as nanomaterial‑based treatments, while established engineering consultancies provide comprehensive project delivery. Strong stakeholder engagement and public‑sector commitment combine to create an environment conducive to rapid market growth.
Contaminant Remediation Market in France is emerging through strategic emphasis on green recovery and the revitalization of legacy industrial zones. Government incentives promote the adoption of low‑impact remediation techniques that align with national climate objectives. Multidisciplinary research clusters unite chemists, microbiologists, and engineers to advance innovative solutions tailored to diverse contamination scenarios. Growing collaboration between regional authorities and private operators fosters the scaling of pilot projects into broader commercial applications, positioning France as an increasingly influential player in the European landscape.
Asia Pacific is strengthening its position by harnessing rapid industrialization alongside a growing awareness of environmental stewardship. Nations across the region are implementing progressively stricter environmental standards that compel proactive remediation of contaminated sites. Investment in research and development is spurring the creation of cost‑effective, low‑energy treatment technologies suited to the diverse geological conditions found throughout the area. Cross‑border knowledge exchange and regional partnerships enable the diffusion of best practices, while governmental commitment to sustainable urban development drives demand for innovative cleanup solutions. This convergence of regulatory momentum, technological advancement, and strategic collaboration is elevating Asia Pacific’s role in the global contaminant remediation landscape.
Contaminant Remediation Market in Japan benefits from a mature technological base and a cultural emphasis on precision and long‑term environmental responsibility. Advanced engineering firms apply cutting‑edge remediation methods, including electrokinetic and membrane technologies, to address complex contamination challenges. Strong collaboration between universities and industry accelerates the commercialization of research breakthroughs. Government policies that integrate remediation into broader disaster‑recovery and urban‑renewal programs further stimulate market activity, reinforcing Japan’s reputation for high‑quality environmental solutions.
Contaminant Remediation Market activity in South Korea is propelled by a forward‑looking approach that blends rigorous environmental regulations with aggressive investment in green technology. The nation’s strong manufacturing sector drives demand for efficient, scalable remediation processes that minimize downtime. Partnerships between technology incubators and established environmental firms foster the rapid adoption of innovative treatments such as bioaugmentation and advanced oxidation. Policy frameworks that prioritize sustainable development ensure that remediation remains a central focus within the country’s broader economic growth strategy.
To know more about the market opportunities by region and country, click here to
Buy The Complete Report
Increasing Environmental Regulations are Driving Adoption
Advanced Remediation Technologies are Enhancing Efficiency
High Treatment Costs are Limiting Adoption
Stringent Permitting Processes are Slowing Deployment
Request Free Customization of this report to help us to meet your business objectives.
Top Player’s Company Profile
Recent Developments
SkyQuest’s ABIRAW (Advanced Business Intelligence, Research & Analysis Wing) is our Business Information Services team that Collects, Collates, Correlates, and Analyses the Data collected by means of Primary Exploratory Research backed by robust Secondary Desk research. As per SkyQuest analysis, the global contaminant remediation market is propelled chiefly by tightening environmental regulations that force companies to adopt effective cleanup solutions, while advanced remediation technologies such as bioremediation and in‑situ chemical oxidation provide a second boost by improving treatment speed and sustainability. High treatment costs act as a restraint, limiting project initiation especially where budgets are tight. North America remains the dominant region thanks to strict legislation, strong research institutions and a dense network of service providers. Within the market, bioremediation leads the segment landscape, offering natural, low‑carbon pathways and cost‑effective outcomes for stakeholders across diverse sites.
| Report Metric | Details |
|---|---|
| Market size value in 2024 | USD 16.9 Billion |
| Market size value in 2033 | USD 27.14 Billion |
| Growth Rate | 5.4% |
| Base year | 2024 |
| Forecast period | (2026-2033) |
| Forecast Unit (Value) | USD Billion |
| Segments covered |
|
| Regions covered | North America (US, Canada), Europe (Germany, France, United Kingdom, Italy, Spain, Rest of Europe), Asia Pacific (China, India, Japan, Rest of Asia-Pacific), Latin America (Brazil, Rest of Latin America), Middle East & Africa (South Africa, GCC Countries, Rest of MEA) |
| Companies covered |
|
| Customization scope | Free report customization with purchase. Customization includes:-
|
To get a free trial access to our platform which is a one stop solution for all your data requirements for quicker decision making. This platform allows you to compare markets, competitors who are prominent in the market, and mega trends that are influencing the dynamics in the market. Also, get access to detailed SkyQuest exclusive matrix.
Table Of Content
Executive Summary
Market overview
Parent Market Analysis
Market overview
Market size
KEY MARKET INSIGHTS
COVID IMPACT
MARKET DYNAMICS & OUTLOOK
Market Size by Region
KEY COMPANY PROFILES
Methodology
For the Contaminant Remediation Market, our research methodology involved a mixture of primary and secondary data sources. Key steps involved in the research process are listed below:
1. Information Procurement: This stage involved the procurement of Market data or related information via primary and secondary sources. The various secondary sources used included various company websites, annual reports, trade databases, and paid databases such as Hoover's, Bloomberg Business, Factiva, and Avention. Our team did 45 primary interactions Globally which included several stakeholders such as manufacturers, customers, key opinion leaders, etc. Overall, information procurement was one of the most extensive stages in our research process.
2. Information Analysis: This step involved triangulation of data through bottom-up and top-down approaches to estimate and validate the total size and future estimate of the Contaminant Remediation Market.
3. Report Formulation: The final step entailed the placement of data points in appropriate Market spaces in an attempt to deduce viable conclusions.
4. Validation & Publishing: Validation is the most important step in the process. Validation & re-validation via an intricately designed process helped us finalize data points to be used for final calculations. The final Market estimates and forecasts were then aligned and sent to our panel of industry experts for validation of data. Once the validation was done the report was sent to our Quality Assurance team to ensure adherence to style guides, consistency & design.
Analyst Support
Customization Options
With the given market data, our dedicated team of analysts can offer you the following customization options are available for the Contaminant Remediation Market:
Product Analysis: Product matrix, which offers a detailed comparison of the product portfolio of companies.
Regional Analysis: Further analysis of the Contaminant Remediation Market for additional countries.
Competitive Analysis: Detailed analysis and profiling of additional Market players & comparative analysis of competitive products.
Go to Market Strategy: Find the high-growth channels to invest your marketing efforts and increase your customer base.
Innovation Mapping: Identify racial solutions and innovation, connected to deep ecosystems of innovators, start-ups, academics, and strategic partners.
Category Intelligence: Customized intelligence that is relevant to their supply Markets will enable them to make smarter sourcing decisions and improve their category management.
Public Company Transcript Analysis: To improve the investment performance by generating new alpha and making better-informed decisions.
Social Media Listening: To analyze the conversations and trends happening not just around your brand, but around your industry as a whole, and use those insights to make better Marketing decisions.
REQUEST FOR SAMPLE
 REQUEST FREE CUSTOMIZATION


Want to customize this report? This report can be personalized according to your needs. Our analysts and industry experts will work directly with you to understand your requirements and provide you with customized data in a short amount of time. We offer $1000 worth of FREE customization at the time of purchase.
Feedback From Our Clients


 USA (+1) 351-333-4748

