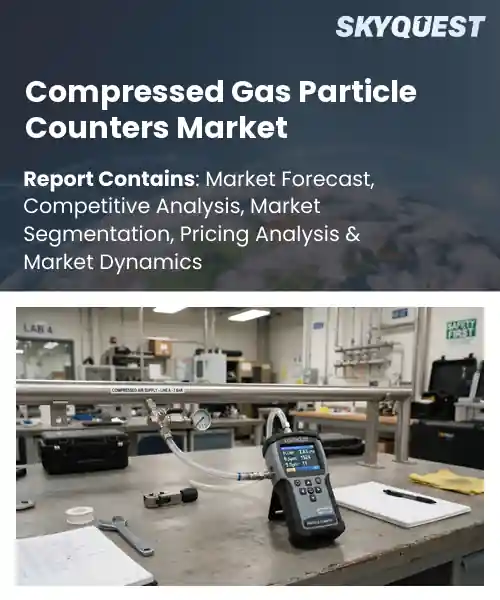
Compressed Gas Particle Counters Market
Report ID: SQMIG45J2940
Report ID: SQMIG45J2940
[email protected]
USA +1 351-333-4748
Report ID:
SQMIG45J2940 |
Region:
Global |
Published Date: August, 2026
Pages:
157
|Tables:
119
|Figures:
77


Global Compressed Gas Particle Counters Market size was valued at USD 694.0 Million in 2024 and is poised to grow from USD 752.99 Million in 2025 to USD 1446.2 Million by 2033, growing at a CAGR of 8.5% during the forecast period (2026-2033).
The global compressed gas particle counters market supplies instruments that measure particulate contamination in high‑purity gas streams used across semiconductor fabrication, pharmaceutical manufacturing, and aerospace propulsion. Its importance stems from the need to protect sensitive equipment from abrasive particles that can cause yield loss or safety incidents. The market emerged in the early 2000s when clean‑room standards tightened, prompting manufacturers to adopt laser‑based scattering sensors for real‑time monitoring. Over the past decade, advances in optical detection and miniaturization have lowered costs, enabling broader adoption in smaller facilities. Consequently, demand has shifted from niche laboratory tools to integrated process‑control solutions for enhanced product reliability worldwide.
Building on this expanding adoption, the primary growth catalyst now lies in the tightening of regulatory frameworks that mandate ultra‑low particle levels for critical gas supplies. As governments impose stricter emissions and contamination limits, manufacturers must integrate continuous monitoring to avoid costly shutdowns, creating a clear cause‑and‑effect loop between compliance pressure and equipment investment. Real‑world examples include semiconductor fabs in Taiwan upgrading to inline counters that detect particles as small as 0.1 µm, and aerospace firms employing portable units during rocket fuel loading to prevent nozzle erosion. These applications open opportunities for service contracts, data‑analytics platforms, and aftermarket upgrades, driving revenue beyond hardware sales.
How is AI integration improving measurement accuracy in the compressed gas particle counters market?
AI integration is reshaping compressed gas particle counters by embedding intelligent algorithms directly into the measurement hardware. Modern counters use machine‑learning models to filter out background noise, recognize particle signatures, and auto‑calibrate based on real‑time environmental data. This reduces human‑induced bias and enables consistent detection across varying pressure and temperature conditions. Vendors are coupling high‑speed optical sensors with edge‑AI processors, allowing instantaneous data interpretation and adaptive threshold setting. As the market expands, these capabilities translate into faster quality‑control cycles and lower false‑alarm rates, making the technology more reliable for pharmaceutical, semiconductor, clean‑room, and aerospace industries worldwide as well.
GQF Water in June 2026, launched an AI‑enhanced compressed‑gas particle counter that continuously learns from sample streams, automatically adjusts calibration and isolates anomalous readings. This innovation sharpens measurement accuracy, reduces downtime and reinforces the market’s momentum toward smarter, more efficient monitoring solutions for critical processes in pharma, electronics, and aerospace sectors worldwide.
Market snapshot - (2026-2033)
Global Market Size
USD 694.0 Million
Largest Segment
Benchtop Particle Counters
Fastest Growth
Portable Particle Counters
Growth Rate
8.5% CAGR
To get more insights on this market click here to Request a Free Sample Report
Global compressed gas particle counters market is segmented by product type, gas type, application, end user and region. Based on product type, the market is segmented into Portable Particle Counters, Benchtop Particle Counters and Online Particle Monitoring Systems. Based on gas type, the market is segmented into Compressed Air, Nitrogen, Oxygen and Other Industrial Gases. Based on application, the market is segmented into Pharmaceutical Manufacturing, Semiconductor Manufacturing, Food & Beverage Processing and Industrial Manufacturing. Based on end user, the market is segmented into Manufacturing Facilities, Testing Laboratories and Cleanroom Operators. Based on region, the market is segmented into North America, Europe, Asia Pacific, Latin America and Middle East & Africa.
Portable particle counters segment dominates because field engineers require immediate, on site contamination data, enabling rapid corrective actions that keep production lines running. Their handheld form factor aligns with mobile maintenance schedules, and the ability to sample directly from compressed gas lines reduces downtime. This convenience and operational agility drive widespread adoption across diverse industrial settings, cementing its leadership in the market globally and supporting compliance with stringent quality standards.
However, benchtop particle counters segment is witnessing the strongest growth momentum because manufacturers are integrating resolution optical sensors that deliver size discrimination for compressed gases. This capability meets rising quality control demands in regulated environments, prompting investment in fixed point monitoring stations that enhance process stability and open revenue streams.
Semiconductor manufacturing segment dominates because wafer fab facilities operate under ultra low particulate thresholds, making precise gas phase particle detection essential for yield preservation. The intricate photolithography and etching steps generate nanoscale contaminants that can only be monitored with sensitive counters, driving procurement. Moreover, industry standards compel fabs to maintain real time cleanliness, reinforcing the role of these counters in sustaining competitive advantage across global supply chains and product lifecycles.
Meanwhile, pharmaceutical manufacturing segment emerges as the key high growth area because biologics production requires sterile gas supplies, prompting adoption of particle counters to verify contaminant free environments. Regulatory guidance and demand for injectable therapies accelerate investments, while innovations in sensor miniaturization enable integration into cleanroom workflows, fueling market expansion.
To get detailed segments analysis, Request a Free Sample Report
North America enjoys a confluence of advanced manufacturing capabilities, deep research expertise, and a regulatory environment that encourages high‑precision quality control. The region hosts a dense network of leading aerospace, semiconductor, and pharmaceutical manufacturers that rely on exact particle measurement for product integrity. Robust funding mechanisms support continuous innovation in sensor technology, while well‑established supply chains enable rapid integration of new instruments. Skilled engineering talent and a culture of early adoption further reinforce market leadership, allowing North American firms to set performance benchmarks that shape global standards.
Compressed Gas Particle Counters Market in the United States benefits from a strong presence of technology innovators and a mature industrial ecosystem. Demand is driven by high‑volume semiconductor fabs, aerospace testing facilities, and rigorous pharmaceutical production lines that prioritize particle‑free environments. Collaboration between research universities and private firms accelerates development of next‑generation sensors, while a flexible funding landscape encourages rapid commercialization. The United States also leverages extensive standard‑setting bodies that promote harmonized testing practices across sectors.
Compressed Gas Particle Counters Market in Canada thrives on a blend of resource‑intensive industries and high‑tech research hubs. The country’s aerospace and clean‑technology sectors demand precise particle monitoring to meet stringent safety and environmental criteria. Strong governmental support for innovation fosters partnerships between academic institutions and equipment manufacturers, resulting in tailored solutions for niche applications. A skilled workforce and proximity to United States supply chains further bolster Canada’s ability to serve both domestic and cross‑border customers efficiently.
Europe’s expansion is propelled by rigorous environmental and safety directives that compel manufacturers to adopt sophisticated particle monitoring. The region’s dense concentration of high‑tech clusters, particularly in automotive, life sciences, and microelectronics, creates a persistent need for reliable contamination control. Collaborative research initiatives across borders accelerate technology diffusion, while standardized regulatory frameworks simplify market entry for innovative products. Government incentives for sustainable manufacturing and strong intellectual property protections foster a vibrant ecosystem where original equipment manufacturers and specialized service providers thrive together.
Compressed Gas Particle Counters Market in Germany is anchored by world‑renowned engineering precision and a strong automotive supply chain that demands ultra‑clean manufacturing environments. The country’s pharmaceutical and chemical sectors also rely on meticulous particle detection to ensure product safety. Close cooperation between industry associations and research institutes drives continuous improvement of sensor accuracy and durability. A robust standards framework ensures compatibility across diverse applications, reinforcing Germany’s position as a benchmark for quality and reliability.
Compressed Gas Particle Counters Market in the United Kingdom experiences accelerated growth fueled by an intensive focus on life‑science research and aerospace development. Leading universities and research hospitals generate substantial demand for advanced particle monitoring to support cutting‑edge experimentation. Public‑private partnerships fund the creation of bespoke instrumentation that meets stringent UK regulatory requirements. The nation’s emphasis on innovation hubs and export‑oriented manufacturing further amplifies its role as a fast‑moving contributor to the European market.
Compressed Gas Particle Counters Market in France is emerging through strategic investments in aerospace, biotechnology, and high‑performance materials. French industrial clusters prioritize contamination control to meet both domestic standards and international export criteria. Collaborative programs linking government agencies with specialized producers encourage the development of compact, high‑resolution counters suited for diverse applications. The country’s strong emphasis on sustainable manufacturing practices also creates a favorable environment for the adoption of advanced particle detection technologies.
Asia Pacific is reinforcing its market stance by coupling rapid industrialization with a heightened focus on product quality and environmental stewardship. Growing electronics and semiconductor production facilities require precise particle monitoring to maintain yield and reliability. Governments across the region are promoting advanced manufacturing policies that emphasize cleanroom standards and technology transfer, encouraging local firms to upscale capabilities. Collaboration between multinational corporations and indigenous suppliers accelerates the diffusion of high‑performance counters, while cost‑effective engineering solutions make adoption accessible to a broad spectrum of manufacturers.
Compressed Gas Particle Counters Market in Japan is driven by a legacy of meticulous quality control in electronics, automotive, and precision optics sectors. The nation’s commitment to continuous improvement fuels demand for highly sensitive and durable particle measurement equipment. Close ties between device manufacturers and sensor developers enable rapid prototyping and customization for specific industry needs. Government initiatives that promote advanced manufacturing environments further reinforce Japan’s reputation for excellence in contamination detection.
Compressed Gas Particle Counters Market in South Korea benefits from a dynamic semiconductor and display panel industry that prioritizes ultra‑clean processing conditions. Strong collaboration between leading conglomerates and specialized instrumentation firms accelerates the introduction of innovative counter technologies. National policies encouraging smart factory adoption and stringent environmental standards create a fertile landscape for advanced particle monitoring solutions. The emphasis on rapid scaling and technology integration positions South Korea as a rising influence within the regional market.
To know more about the market opportunities by region and country, click here to
Buy The Complete Report
Increasing Healthcare Testing Requirements
Advancements in Sensor Technology
High Capital Investment Costs
Regulatory Compliance Complexity
Request Free Customization of this report to help us to meet your business objectives.
Competitive dynamics are driven by established manufacturers expanding compressed‑gas sensor portfolios and leveraging advanced laser‑scattering technology. Particle Measuring Systems, TSI Incorporated, Beckman Coulter, Fluke Corporation and Met One Instruments are intensifying R&D and forming distribution alliances to capture emerging clean‑room and pharmaceutical applications. These moves aim to secure market share as demand rises for higher‑resolution monitoring in semiconductor fabs and biotech labs.
Top Player’s Company Profile
SkyQuest’s ABIRAW (Advanced Business Intelligence, Research & Analysis Wing) is our Business Information Services team that Collects, Collates, Correlates, and Analyses the Data collected by means of Primary Exploratory Research backed by robust Secondary Desk research.
As per SkyQuest analysis, the global compressed gas particle counters market globally is being propelled primarily by the rising healthcare testing requirements that compel manufacturers to ensure ultra‑clean gas streams, while rapid advancements in sensor technology and AI‑driven analytics provide sharper detection and lower maintenance, acting as a second growth catalyst. High capital investment costs remain the main restraint, limiting adoption among smaller firms. North America continues to dominate the market due to its mature semiconductor, aerospace and pharmaceutical base, and portable particle counters lead the product‑type segment by offering on‑site rapid measurements that align with strict compliance schedules today.
| Report Metric | Details |
|---|---|
| Market size value in 2024 | USD 694.0 Million |
| Market size value in 2033 | USD 1446.2 Million |
| Growth Rate | 8.5% |
| Base year | 2024 |
| Forecast period | (2026-2033) |
| Forecast Unit (Value) | USD Million |
| Segments covered |
|
| Regions covered | North America (US, Canada), Europe (Germany, France, United Kingdom, Italy, Spain, Rest of Europe), Asia Pacific (China, India, Japan, Rest of Asia-Pacific), Latin America (Brazil, Rest of Latin America), Middle East & Africa (South Africa, GCC Countries, Rest of MEA) |
| Companies covered |
|
| Customization scope | Free report customization with purchase. Customization includes:-
|
To get a free trial access to our platform which is a one stop solution for all your data requirements for quicker decision making. This platform allows you to compare markets, competitors who are prominent in the market, and mega trends that are influencing the dynamics in the market. Also, get access to detailed SkyQuest exclusive matrix.
Table Of Content
Executive Summary
Market overview
Parent Market Analysis
Market overview
Market size
KEY MARKET INSIGHTS
COVID IMPACT
MARKET DYNAMICS & OUTLOOK
Market Size by Region
KEY COMPANY PROFILES
Methodology
For the Compressed Gas Particle Counters Market, our research methodology involved a mixture of primary and secondary data sources. Key steps involved in the research process are listed below:
1. Information Procurement: This stage involved the procurement of Market data or related information via primary and secondary sources. The various secondary sources used included various company websites, annual reports, trade databases, and paid databases such as Hoover's, Bloomberg Business, Factiva, and Avention. Our team did 45 primary interactions Globally which included several stakeholders such as manufacturers, customers, key opinion leaders, etc. Overall, information procurement was one of the most extensive stages in our research process.
2. Information Analysis: This step involved triangulation of data through bottom-up and top-down approaches to estimate and validate the total size and future estimate of the Compressed Gas Particle Counters Market.
3. Report Formulation: The final step entailed the placement of data points in appropriate Market spaces in an attempt to deduce viable conclusions.
4. Validation & Publishing: Validation is the most important step in the process. Validation & re-validation via an intricately designed process helped us finalize data points to be used for final calculations. The final Market estimates and forecasts were then aligned and sent to our panel of industry experts for validation of data. Once the validation was done the report was sent to our Quality Assurance team to ensure adherence to style guides, consistency & design.
Analyst Support
Customization Options
With the given market data, our dedicated team of analysts can offer you the following customization options are available for the Compressed Gas Particle Counters Market:
Product Analysis: Product matrix, which offers a detailed comparison of the product portfolio of companies.
Regional Analysis: Further analysis of the Compressed Gas Particle Counters Market for additional countries.
Competitive Analysis: Detailed analysis and profiling of additional Market players & comparative analysis of competitive products.
Go to Market Strategy: Find the high-growth channels to invest your marketing efforts and increase your customer base.
Innovation Mapping: Identify racial solutions and innovation, connected to deep ecosystems of innovators, start-ups, academics, and strategic partners.
Category Intelligence: Customized intelligence that is relevant to their supply Markets will enable them to make smarter sourcing decisions and improve their category management.
Public Company Transcript Analysis: To improve the investment performance by generating new alpha and making better-informed decisions.
Social Media Listening: To analyze the conversations and trends happening not just around your brand, but around your industry as a whole, and use those insights to make better Marketing decisions.
REQUEST FOR SAMPLE
 REQUEST FREE CUSTOMIZATION
Global Compressed Gas Particle Counters Market size was valued at USD 694.0 Million in 2024 and is poised to grow from USD 752.99 Million in 2025 to USD 1446.2 Million by 2033, growing at a CAGR of 8.5% during the forecast period (2026-2033).
Competitive dynamics are driven by established manufacturers expanding compressed‑gas sensor portfolios and leveraging advanced laser‑scattering technology. Particle Measuring Systems, TSI Incorporated, Beckman Coulter, Fluke Corporation and Met One Instruments are intensifying R&D and forming distribution alliances to capture emerging clean‑room and pharmaceutical applications. These moves aim to secure market share as demand rises for higher‑resolution monitoring in semiconductor fabs and biotech labs. 'Particle Measuring Systems, Inc.', 'TSI Incorporated', 'RION Co., Ltd.', 'Beckman Coulter, Inc.', 'Lighthouse Worldwide Solutions', 'PAMAS Partikelmess- und Analysesysteme GmbH', 'Climet Instruments Company', 'Kanomax USA, Inc.', 'Met One Instruments, Inc.', 'HAL Technology, LLC', 'Chemtrac Systems, Inc.', 'Palas GmbH', 'TOPAS GmbH', 'HORIBA, Ltd.', 'Sensirion AG', 'Aeroqual Limited', 'EMD Millipore Corporation', 'Testo SE & Co. KGaA', 'Fluke Corporation', 'Airy Technology, Inc.'
Advanced Sensor Integration: Manufacturers are embedding compressed‑gas particle counters directly into production equipment, enabling real‑time contamination monitoring without separate instrumentation. This integration reduces manual sampling, shortens response times, and supports automated control loops that adjust processes instantly when particle levels exceed thresholds. As a result, facilities achieve higher product quality, lower waste, and improved compliance with internal standards, driving broader adoption of integrated solutions across semiconductor, pharmaceutical, and food‑processing sectors, and enable predictive maintenance strategies that further enhance operational efficiency and cost savings.
Why does North America Dominate the Global Compressed Gas Particle Counters Market? |@12


Want to customize this report? This report can be personalized according to your needs. Our analysts and industry experts will work directly with you to understand your requirements and provide you with customized data in a short amount of time. We offer $1000 worth of FREE customization at the time of purchase.
Feedback From Our Clients


 USA (+1) 351-333-4748

