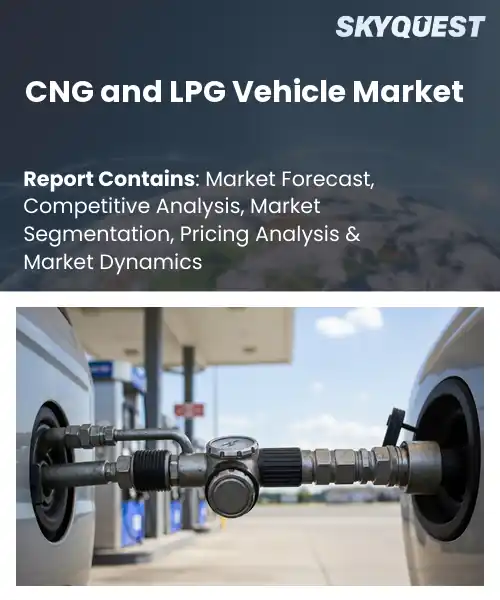
CNG and LPG Vehicle Market

Report ID: SQMIG25C2270

[email protected]
USA +1 351-333-4748

CNG and LPG Vehicle Market Size, Share, and Growth Analysis

CNG and LPG Vehicle Market

CNG and LPG Vehicle Market By Fuel Type (Compressed Natural Gas, Liquefied Petroleum Gas), By Vehicle Type (Passenger Cars, Light Commercial Vehicles, Heavy Commercial Vehicles, Two-Wheelers, Three-Wheelers), By Fitment Execution, By Engine Technology, By Region - Industry Forecast 2026-2033


Report ID: SQMIG25C2270 | Region: Global | Published Date: July, 2026
Pages: 157 |Tables: 117 |Figures: 77

Format - word format excel data power point presentation

CNG and LPG Vehicle Market Insights

Global Cng And Lpg Vehicle Market size was valued at USD 15.17 Billion in 2024 and is poised to grow from USD 16.33 Billion in 2025 to USD 29.45 Billion by 2033, growing at a CAGR of 7.65% during the forecast period (2026-2033).

Government incentives and expanding refueling infrastructure form the second decisive factor accelerating market growth because subsidies lower acquisition costs while a network eases range anxiety. When Delhi’s municipal corporation introduced tax rebates for CNG taxis in 2015, operators cut operating expenses by 30 percent, prompting fleet conversion that spurred investors to fund stations along routes. Likewise, Mexico’s LPG subsidy enabled over two million light‑duty vehicles to switch fuels, creating demand for conversion kits and jobs in the sector. These cause‑and‑effect dynamics show how cost advantages drive adoption, which in turn fuels infrastructure and opens opportunities for manufacturers to develop engines.

How is AI-driven analytics shaping demand for CNG and LPG vehicles?

AI driven analytics is transforming how manufacturers and dealers anticipate buyer interest in CNG and LPG vehicles. By ingesting fuel price trends, traffic patterns and consumer sentiment, algorithms generate real time insights that guide production schedules and marketing spend. This capability lets OEMs align inventory with regional demand spikes, especially in markets where price volatility drives shifts toward alternative fuels. Dealership networks use predictive tools to target customers who are most likely to consider a CNG or LPG model, improving conversion rates. As a result the sector sees faster response to policy changes and a more efficient allocation of resources.Tata Motors November 2025, introduced an AI powered demand forecasting platform that matches CNG and LPG vehicle supply with localized fuel cost data, cutting lead times and boosting dealer confidence. The tool demonstrates how analytics can directly lift market growth by enabling more precise inventory planning and targeted promotions.

Market snapshot - (2026-2033)

Global Market Size

USD 15.17 Billion

Largest Segment

Compressed Natural Gas

Fastest Growth

Liquefied Petroleum Gas

Growth Rate

7.65% CAGR

CNG and LPG Vehicle Market ($ Bn)
Country Share for Asia Pacific Region (%)

To get more insights on this market click here to Request a Free Sample Report

CNG and LPG Vehicle Market Segments Analysis

Global cng and lpg vehicle market is segmented by fuel type, vehicle type, fitment execution, engine technology and region. Based on fuel type, the market is segmented into Compressed Natural Gas and Liquefied Petroleum Gas. Based on vehicle type, the market is segmented into Passenger Cars, Light Commercial Vehicles, Heavy Commercial Vehicles, Two-Wheelers and Three-Wheelers. Based on fitment execution, the market is segmented into Factory Fitted and Aftermarket Retrofitted. Based on engine technology, the market is segmented into Dedicated Gas Engines, Bi-Fuel Engines and Dual-Fuel Engines. Based on region, the market is segmented into North America, Europe, Asia Pacific, Latin America and Middle East & Africa.

What role does compressed natural gas play in shaping the cng and lpg vehicle market?

Compressed Natural Gas segment dominates because it aligns closely with existing natural gas distribution infrastructure, offering a cost effective alternative to petrol and diesel. Automakers favor CNG due to lower fuel consumption and reduced emissions, which meet tightening environmental standards. The technology maturity and proven safety record encourage OEMs to integrate CNG systems at design stage, reinforcing its market leadership and attracting fleet operators seeking long term operational savings.

However, Liquefied Petroleum Gas segment is witnessing the strongest growth momentum because its higher energy density simplifies vehicle range concerns and enables easier retrofitting in dense urban fleets. Emerging regulatory incentives for low carbon mobility and expanding LPG refueling networks drive rapid adoption, positioning it as a key catalyst for future market expansion.

how are passenger cars influencing the cng and lpg vehicle market?

Passenger Cars segment leads because consumer demand for affordable, low emission mobility drives manufacturers to prioritize CNG and LPG powertrains in compact models. Urban congestion and fuel cost sensitivity push buyers toward alternative fuels, while policy incentives reward cleaner personal transport. Automakers integrate dedicated gas engines early, leveraging existing platforms to meet emissions targets, thereby cementing passenger cars as the primary growth engine for the market.

Meanwhile, Light Commercial Vehicles segment is emerging as the key high growth area because logistics operators seek fuel efficient solutions to lower operating expenses. The flexibility of bi fuel systems allows seamless switching between gas and conventional fuels, enhancing route reliability. Growing e commerce demand and stricter emission regulations stimulate adoption, expanding market opportunities and driving future expansion.

CNG and LPG Vehicle Market By Fuel Type

To get detailed segments analysis, Request a Free Sample Report

CNG and LPG Vehicle Market Regional Insights

Why does Asia Pacific Dominate the Global CNG and LPG Vehicle Market?

The region benefits from a confluence of supportive government policies, advanced manufacturing ecosystems, and a cultural emphasis on sustainable mobility. Robust emission standards encourage alternatives to conventional fuels, while extensive urban networks create demand for cleaner, cost‑effective transportation. Strong domestic automotive suppliers enable rapid development of dual‑fuel technologies, and well‑established natural gas infrastructure lowers barriers to adoption. Consumer awareness of environmental impact further fuels market momentum, positioning Asia Pacific as a leader in both production capacity and adoption rates.

Japan CNG and LPG Vehicle Market

CNG and LPG Vehicle Market in Japan thrives on stringent environmental regulations that push manufacturers toward low‑emission solutions. Established fuel‑distribution networks and a mature automotive sector facilitate seamless integration of dual‑fuel systems. Consumer preference for reliable, efficient vehicles aligns with government incentives, encouraging widespread deployment across urban and suburban fleets.

South Korea CNG and LPG Vehicle Market

CNG and LPG Vehicle Market in South Korea is propelled by proactive policy frameworks that prioritize clean‑energy transportation. Strong collaboration between government agencies and automotive OEMs accelerates technology rollout. An extensive pipeline network and growing public‑private partnerships support infrastructure expansion, while heightened environmental consciousness among drivers sustains demand for dual‑fuel options.

What is Driving the Rapid Expansion of CNG and LPG Vehicle Market in Europe?

Europe’s commitment to decarbonization creates a fertile environment for CNG and LPG adoption. Rigorous emission standards compel manufacturers to explore alternative fuels, while generous incentive schemes lower ownership costs for consumers and fleet operators. Extensive natural gas distribution coupled with coordinated cross‑border infrastructure projects enhances market accessibility. A sophisticated engineering base drives innovation in efficient dual‑fuel powertrains, and urban congestion policies favor cleaner vehicle solutions. Together, these factors generate strong momentum across the continent.

Germany CNG and LPG Vehicle Market

CNG and LPG Vehicle Market in Germany benefits from a robust regulatory landscape that rewards low‑emission technologies. Leading automotive manufacturers invest heavily in dual‑fuel research, ensuring high‑quality offerings. A dense network of refueling stations supports both commercial and private usage, while consumer confidence in engineering excellence sustains market growth.

United Kingdom CNG and LPG Vehicle Market

CNG and LPG Vehicle Market in United Kingdom experiences accelerated uptake due to proactive government grants and a vibrant green‑mobility agenda. Urban centers prioritize cleaner transport, driving fleet conversions. Established gas distribution corridors and emerging charging infrastructure complement each other, encouraging broader acceptance among private owners and logistics providers.

France CNG and LPG Vehicle Market

CNG and LPG Vehicle Market in France is emerging as policy incentives align with growing public demand for sustainable travel. Strategic investments in refueling infrastructure expand geographic coverage, while collaborative initiatives between manufacturers and energy firms foster technology adaptation. Consumer awareness of environmental benefits further fuels gradual market penetration.

How is North America Strengthening its Position in CNG and LPG Vehicle Market?

North America leverages abundant natural gas resources and a pragmatic regulatory approach to advance CNG and LPG vehicle adoption. Collaborative efforts between federal agencies and industry stakeholders streamline standards and promote infrastructure development. Fleet operators, particularly in logistics and public transportation, recognize the cost‑effective nature of dual‑fuel solutions, driving large‑scale conversions. Innovation hubs accelerate the refinement of efficient powertrains, while market‑driven incentives encourage private ownership. This integrated strategy enhances the region’s competitive edge and reinforces its role as a key market for alternative fuels.

United States CNG and LPG Vehicle Market

CNG and LPG Vehicle Market in United States thrives on a supportive policy environment that encourages clean‑fuel technologies across state and federal levels. Expansive natural gas pipelines and an extensive network of refueling stations facilitate widespread usage. Corporate fleet programs and consumer interest in lower operating costs accelerate market acceptance, while ongoing research collaborations improve vehicle performance.

Canada CNG and LPG Vehicle Market

CNG and LPG Vehicle Market in Canada capitalizes on abundant domestic gas supplies and progressive environmental policies. Government incentives for low‑emission vehicles stimulate adoption among municipal fleets and private owners. Emerging refueling infrastructure, paired with strong public awareness of sustainability, positions Canada as a growing hub for dual‑fuel vehicle integration.

CNG and LPG Vehicle Market By Geography
  • Largest
  • Fastest

To know more about the market opportunities by region and country, click here to
Buy The Complete Report

CNG and LPG Vehicle Market Dynamics

Drivers

Growing Environmental Regulations

  • Governments worldwide are introducing stricter emissions standards and offering tax credits, which compel manufacturers to develop CNG and LPG models. These policy actions lower the total cost of ownership for fleet operators and create a favorable regulatory environment. By aligning corporate sustainability goals with compliance requirements, firms are motivated to invest in alternative‑fuel technologies, thereby expanding the product portfolio and stimulating market demand across passenger and commercial vehicle segments. The policy framework also encourages collaborations between energy suppliers and automotive OEMs, fostering innovation in fuel storage solutions and stations.

Expanding Refueling Infrastructure

  • Rapid expansion of CNG and LPG refueling stations across urban and peri‑urban areas reduces range anxiety for potential buyers. As network density improves, fleet operators find it logistically feasible to schedule refueling without significant downtime, enhancing operational efficiency. Convenience of accessible fuel points also influences individual consumers’ purchase decisions, encouraging a shift from conventional gasoline vehicles. This infrastructure growth therefore acts as a catalyst, reinforcing market confidence and accelerating adoption across multiple vehicle categories and supporting the development of hybrid powertrain options.

Restraints

High Initial Vehicle Cost

  • Alternative‑fuel vehicles often command a price premium due to specialized fuel storage systems and advanced emission control technologies. This higher upfront investment challenges budget‑conscious fleet managers and private buyers, especially in price‑sensitive markets. The perceived cost disparity discourages transition from conventional gasoline models, leading to slower market penetration. Additionally, financing options for such vehicles may be limited, further compounding the affordability issue and restraining broader adoption despite long‑term operating cost benefits. Consequently, many organizations postpone investments until economies of scale reduce pricing.

Limited Consumer Awareness

  • Many consumers lack sufficient knowledge about the operational advantages and safety aspects of CNG and LPG vehicles. This information gap leads to misconceptions regarding refueling convenience, vehicle performance, and long‑term reliability. Without clear understanding, potential buyers often default to familiar gasoline options, perceiving alternative fuels as risky or inconvenient. Moreover, limited marketing efforts and scarce educational initiatives by manufacturers and policymakers exacerbate this uncertainty, further slowing market acceptance and hindering growth. The resulting hesitation reduces test‑drive participation and delays purchase decisions.

Request Free Customization of this report to help us to meet your business objectives.

CNG and LPG Vehicle Market Competitive Landscape

The competitive landscape is shaped by major OEMs such as General Motors, Ford, Toyota and Fiat Chrysler, which are expanding CNG/LPG powertrain options and securing supply‑chain partnerships with fuel infrastructure firms; meanwhile, strategic collaborations like the $34 million financing round that brought together AP Ventures, SK Gas, Breakthrough Energy Ventures, Eni Next and Mitsubishi Heavy Industries to back C‑Zero’s pilot plant illustrate how joint ventures and targeted M&A are accelerating technology deployment and market penetration.

  • C‑Zero: Established in 2022, their main objective is to commercialize low‑emission CNG/LPG fuel systems for heavy‑duty vehicles. Recent development: secured a $34 million financing round with AP Ventures, SK Gas, Breakthrough Energy Ventures, Eni Next and Mitsubishi Heavy Industries to launch its first pilot plant.
  • GreenFuelTech: Established in 2023, their main objective is to develop modular CNG/LPG conversion kits for passenger cars. Recent development: closed a seed round of $8 million led by InnovationMap investors to expand production capacity in North America.

Top Player’s Company Profile

  • Maruti Suzuki India Limited
  • Volkswagen AG
  • Hyundai Motor Company
  • Tata Motors Limited
  • Toyota Motor Corporation
  • Ford Motor Company
  • Stellantis N.V.
  • Renault Group
  • Honda Motor Co., Ltd.
  • General Motors Company
  • Iveco Group N.V.
  • Volvo Group
  • Scania AB
  • Daimler Truck Holding AG
  • PACCAR Inc.
  • Bajaj Auto Ltd.
  • Piaggio & C. S.p.A.
  • Mahindra & Mahindra Ltd.
  • Dongfeng Motor Corporation
  • SAIC Motor Co., Ltd.

Recent Developments

  • Toyota Motor Corporation announced in September 2025 the launch of a new CNG‑compatible hybrid SUV designed for emerging markets, featuring integrated high‑pressure CNG storage, refined engine calibration for reduced emissions, and connectivity with Toyota’s telematics platform to optimize fuel efficiency and maintenance alerts for fleet operators across urban and regional routes, enhancing driver comfort and operational reliability.
  • Tata Motors Limited announced in June 2025 a strategic partnership with Gujarat Gas to roll out CNG fueling stations tailored for its new light commercial vehicles, embedding advanced on‑board fuel management that simplifies refueling, extends range, and aligns with Tata’s ambition for zero‑tailpipe emissions in Indian logistics, while also establishing joint technician training programs.
  • Hyundai Motor Company reported in March 2025 the introduction of an LPG dual‑fuel powertrain for its European‑market compact sedan, featuring seamless switching between gasoline and LPG, enhanced cabin comfort through reduced engine noise, and integration with Hyundai’s BlueLink connectivity to provide drivers real‑time fuel cost analytics and service reminders. The system supports updates to optimize performance across diverse driving conditions.

CNG and LPG Vehicle Key Market Trends

CNG and LPG Vehicle Market SkyQuest Analysis

SkyQuest’s ABIRAW (Advanced Business Intelligence, Research & Analysis Wing) is our Business Information Services team that Collects, Collates, Correlates, and Analyses the Data collected by means of Primary Exploratory Research backed by robust Secondary Desk research. As per SkyQuest analysis, the global CNG and LPG vehicle market is being propelled primarily by strong government incentives and the rapid expansion of refueling infrastructure, which lower ownership costs and ease range anxiety, while AI‑driven analytics are further accelerating demand by matching supply with localized fuel‑price trends. The market is led by the Compressed Natural Gas fuel type, reflecting its alignment with existing gas networks, and passenger cars remain the largest vehicle‑type contributor. Asia Pacific dominates the landscape thanks to supportive policies, dense manufacturing bases and extensive gas pipelines. However, the high initial purchase price of gas‑powered vehicles continues to restrain broader adoption, especially in price‑sensitive segments.

Report Metric Details
Market size value in 2024 USD 15.17 Billion
Market size value in 2033 USD 29.45 Billion
Growth Rate 7.65%
Base year 2024
Forecast period (2026-2033)
Forecast Unit (Value) USD Billion
Segments covered
  • Fuel Type
    • Compressed Natural Gas
    • Liquefied Petroleum Gas
  • Vehicle Type
    • Passenger Cars
    • Light Commercial Vehicles
    • Heavy Commercial Vehicles
    • Two-Wheelers
    • Three-Wheelers
  • Fitment Execution
    • Factory Fitted
    • Aftermarket Retrofitted
  • Engine Technology
    • Dedicated Gas Engines
    • Bi-Fuel Engines
    • Dual-Fuel Engines
Regions covered North America (US, Canada), Europe (Germany, France, United Kingdom, Italy, Spain, Rest of Europe), Asia Pacific (China, India, Japan, Rest of Asia-Pacific), Latin America (Brazil, Rest of Latin America), Middle East & Africa (South Africa, GCC Countries, Rest of MEA)
Companies covered
  • Maruti Suzuki India Limited
  • Volkswagen AG
  • Hyundai Motor Company
  • Tata Motors Limited
  • Toyota Motor Corporation
  • Ford Motor Company
  • Stellantis N.V.
  • Renault Group
  • Honda Motor Co., Ltd.
  • General Motors Company
  • Iveco Group N.V.
  • Volvo Group
  • Scania AB
  • Daimler Truck Holding AG
  • PACCAR Inc.
  • Bajaj Auto Ltd.
  • Piaggio & C. S.p.A.
  • Mahindra & Mahindra Ltd.
  • Dongfeng Motor Corporation
  • SAIC Motor Co., Ltd.
Customization scope

Free report customization with purchase. Customization includes:-

  • Segments by type, application, etc
  • Company profile
  • Market dynamics & outlook
  • Region

To get a free trial access to our platform which is a one stop solution for all your data requirements for quicker decision making. This platform allows you to compare markets, competitors who are prominent in the market, and mega trends that are influencing the dynamics in the market. Also, get access to detailed SkyQuest exclusive matrix.

Table Of Content

Executive Summary

Market overview

  • Exhibit: Executive Summary – Chart on Market Overview
  • Exhibit: Executive Summary – Data Table on Market Overview
  • Exhibit: Executive Summary – Chart on CNG and LPG Vehicle Market Characteristics
  • Exhibit: Executive Summary – Chart on Market by Geography
  • Exhibit: Executive Summary – Chart on Market Segmentation
  • Exhibit: Executive Summary – Chart on Incremental Growth
  • Exhibit: Executive Summary – Data Table on Incremental Growth
  • Exhibit: Executive Summary – Chart on Vendor Market Positioning

Parent Market Analysis

Market overview

Market size

  • Market Dynamics
    • Exhibit: Impact analysis of DROC, 2021
      • Drivers
      • Opportunities
      • Restraints
      • Challenges
  • SWOT Analysis

KEY MARKET INSIGHTS

  • Technology Analysis
    • (Exhibit: Data Table: Name of technology and details)
  • Pricing Analysis
    • (Exhibit: Data Table: Name of technology and pricing details)
  • Supply Chain Analysis
    • (Exhibit: Detailed Supply Chain Presentation)
  • Value Chain Analysis
    • (Exhibit: Detailed Value Chain Presentation)
  • Ecosystem Of the Market
    • Exhibit: Parent Market Ecosystem Market Analysis
    • Exhibit: Market Characteristics of Parent Market
  • IP Analysis
    • (Exhibit: Data Table: Name of product/technology, patents filed, inventor/company name, acquiring firm)
  • Trade Analysis
    • (Exhibit: Data Table: Import and Export data details)
  • Startup Analysis
    • (Exhibit: Data Table: Emerging startups details)
  • Raw Material Analysis
    • (Exhibit: Data Table: Mapping of key raw materials)
  • Innovation Matrix
    • (Exhibit: Positioning Matrix: Mapping of new and existing technologies)
  • Pipeline product Analysis
    • (Exhibit: Data Table: Name of companies and pipeline products, regional mapping)
  • Macroeconomic Indicators

COVID IMPACT

  • Introduction
  • Impact On Economy—scenario Assessment
    • Exhibit: Data on GDP - Year-over-year growth 2016-2022 (%)
  • Revised Market Size
    • Exhibit: Data Table on CNG and LPG Vehicle Market size and forecast 2021-2027 ($ million)
  • Impact Of COVID On Key Segments
    • Exhibit: Data Table on Segment Market size and forecast 2021-2027 ($ million)
  • COVID Strategies By Company
    • Exhibit: Analysis on key strategies adopted by companies

MARKET DYNAMICS & OUTLOOK

  • Market Dynamics
    • Exhibit: Impact analysis of DROC, 2021
      • Drivers
      • Opportunities
      • Restraints
      • Challenges
  • Regulatory Landscape
    • Exhibit: Data Table on regulation from different region
  • SWOT Analysis
  • Porters Analysis
    • Competitive rivalry
      • Exhibit: Competitive rivalry Impact of key factors, 2021
    • Threat of substitute products
      • Exhibit: Threat of Substitute Products Impact of key factors, 2021
    • Bargaining power of buyers
      • Exhibit: buyers bargaining power Impact of key factors, 2021
    • Threat of new entrants
      • Exhibit: Threat of new entrants Impact of key factors, 2021
    • Bargaining power of suppliers
      • Exhibit: Threat of suppliers bargaining power Impact of key factors, 2021
  • Skyquest special insights on future disruptions
    • Political Impact
    • Economic impact
    • Social Impact
    • Technical Impact
    • Environmental Impact
    • Legal Impact

Market Size by Region

  • Chart on Market share by geography 2021-2027 (%)
  • Data Table on Market share by geography 2021-2027(%)
  • North America
    • Chart on Market share by country 2021-2027 (%)
    • Data Table on Market share by country 2021-2027(%)
    • USA
      • Exhibit: Chart on Market share 2021-2027 (%)
      • Exhibit: Market size and forecast 2021-2027 ($ million)
    • Canada
      • Exhibit: Chart on Market share 2021-2027 (%)
      • Exhibit: Market size and forecast 2021-2027 ($ million)
  • Europe
    • Chart on Market share by country 2021-2027 (%)
    • Data Table on Market share by country 2021-2027(%)
    • Germany
      • Exhibit: Chart on Market share 2021-2027 (%)
      • Exhibit: Market size and forecast 2021-2027 ($ million)
    • Spain
      • Exhibit: Chart on Market share 2021-2027 (%)
      • Exhibit: Market size and forecast 2021-2027 ($ million)
    • France
      • Exhibit: Chart on Market share 2021-2027 (%)
      • Exhibit: Market size and forecast 2021-2027 ($ million)
    • UK
      • Exhibit: Chart on Market share 2021-2027 (%)
      • Exhibit: Market size and forecast 2021-2027 ($ million)
    • Rest of Europe
      • Exhibit: Chart on Market share 2021-2027 (%)
      • Exhibit: Market size and forecast 2021-2027 ($ million)
  • Asia Pacific
    • Chart on Market share by country 2021-2027 (%)
    • Data Table on Market share by country 2021-2027(%)
    • China
      • Exhibit: Chart on Market share 2021-2027 (%)
      • Exhibit: Market size and forecast 2021-2027 ($ million)
    • India
      • Exhibit: Chart on Market share 2021-2027 (%)
      • Exhibit: Market size and forecast 2021-2027 ($ million)
    • Japan
      • Exhibit: Chart on Market share 2021-2027 (%)
      • Exhibit: Market size and forecast 2021-2027 ($ million)
    • South Korea
      • Exhibit: Chart on Market share 2021-2027 (%)
      • Exhibit: Market size and forecast 2021-2027 ($ million)
    • Rest of Asia Pacific
      • Exhibit: Chart on Market share 2021-2027 (%)
      • Exhibit: Market size and forecast 2021-2027 ($ million)
  • Latin America
    • Chart on Market share by country 2021-2027 (%)
    • Data Table on Market share by country 2021-2027(%)
    • Brazil
      • Exhibit: Chart on Market share 2021-2027 (%)
      • Exhibit: Market size and forecast 2021-2027 ($ million)
    • Rest of South America
      • Exhibit: Chart on Market share 2021-2027 (%)
      • Exhibit: Market size and forecast 2021-2027 ($ million)
  • Middle East & Africa (MEA)
    • Chart on Market share by country 2021-2027 (%)
    • Data Table on Market share by country 2021-2027(%)
    • GCC Countries
      • Exhibit: Chart on Market share 2021-2027 (%)
      • Exhibit: Market size and forecast 2021-2027 ($ million)
    • South Africa
      • Exhibit: Chart on Market share 2021-2027 (%)
      • Exhibit: Market size and forecast 2021-2027 ($ million)
    • Rest of MEA
      • Exhibit: Chart on Market share 2021-2027 (%)
      • Exhibit: Market size and forecast 2021-2027 ($ million)

KEY COMPANY PROFILES

  • Competitive Landscape
    • Total number of companies covered
      • Exhibit: companies covered in the report, 2021
    • Top companies market positioning
      • Exhibit: company positioning matrix, 2021
    • Top companies market Share
      • Exhibit: Pie chart analysis on company market share, 2021(%)

Methodology

For the CNG and LPG Vehicle Market, our research methodology involved a mixture of primary and secondary data sources. Key steps involved in the research process are listed below:

1. Information Procurement: This stage involved the procurement of Market data or related information via primary and secondary sources. The various secondary sources used included various company websites, annual reports, trade databases, and paid databases such as Hoover's, Bloomberg Business, Factiva, and Avention. Our team did 45 primary interactions Globally which included several stakeholders such as manufacturers, customers, key opinion leaders, etc. Overall, information procurement was one of the most extensive stages in our research process.

2. Information Analysis: This step involved triangulation of data through bottom-up and top-down approaches to estimate and validate the total size and future estimate of the CNG and LPG Vehicle Market.

3. Report Formulation: The final step entailed the placement of data points in appropriate Market spaces in an attempt to deduce viable conclusions.

4. Validation & Publishing: Validation is the most important step in the process. Validation & re-validation via an intricately designed process helped us finalize data points to be used for final calculations. The final Market estimates and forecasts were then aligned and sent to our panel of industry experts for validation of data. Once the validation was done the report was sent to our Quality Assurance team to ensure adherence to style guides, consistency & design.

Analyst Support

Customization Options

With the given market data, our dedicated team of analysts can offer you the following customization options are available for the CNG and LPG Vehicle Market:

Product Analysis: Product matrix, which offers a detailed comparison of the product portfolio of companies.

Regional Analysis: Further analysis of the CNG and LPG Vehicle Market for additional countries.

Competitive Analysis: Detailed analysis and profiling of additional Market players & comparative analysis of competitive products.

Go to Market Strategy: Find the high-growth channels to invest your marketing efforts and increase your customer base.

Innovation Mapping: Identify racial solutions and innovation, connected to deep ecosystems of innovators, start-ups, academics, and strategic partners.

Category Intelligence: Customized intelligence that is relevant to their supply Markets will enable them to make smarter sourcing decisions and improve their category management.

Public Company Transcript Analysis: To improve the investment performance by generating new alpha and making better-informed decisions.

Social Media Listening: To analyze the conversations and trends happening not just around your brand, but around your industry as a whole, and use those insights to make better Marketing decisions.

$5,300

REQUEST FOR SAMPLE

Please verify that you're not a robot to proceed!
Want to customize this report? REQUEST FREE CUSTOMIZATION

FAQs

Global Cng And Lpg Vehicle Market size was valued at USD 15.17 Billion in 2024 and is poised to grow from USD 16.33 Billion in 2025 to USD 29.45 Billion by 2033, growing at a CAGR of 7.65% during the forecast period (2026-2033).

The competitive landscape is shaped by major OEMs such as General Motors, Ford, Toyota and Fiat Chrysler, which are expanding CNG/LPG powertrain options and securing supply‑chain partnerships with fuel infrastructure firms; meanwhile, strategic collaborations like the $34 million financing round that brought together AP Ventures, SK Gas, Breakthrough Energy Ventures, Eni Next and Mitsubishi Heavy Industries to back C‑Zero’s pilot plant illustrate how joint ventures and targeted M&A are accelerating technology deployment and market penetration. 'Maruti Suzuki India Limited', 'Volkswagen AG', 'Hyundai Motor Company', 'Tata Motors Limited', 'Toyota Motor Corporation', 'Ford Motor Company', 'Stellantis N.V.', 'Renault Group', 'Honda Motor Co., Ltd.', 'General Motors Company', 'Iveco Group N.V.', 'Volvo Group', 'Scania AB', 'Daimler Truck Holding AG', 'PACCAR Inc.', 'Bajaj Auto Ltd.', 'Piaggio & C. S.p.A.', 'Mahindra & Mahindra Ltd.', 'Dongfeng Motor Corporation', 'SAIC Motor Co., Ltd.'

Governments worldwide are introducing stricter emissions standards and offering tax credits, which compel manufacturers to develop CNG and LPG models. These policy actions lower the total cost of ownership for fleet operators and create a favorable regulatory environment. By aligning corporate sustainability goals with compliance requirements, firms are motivated to invest in alternative‑fuel technologies, thereby expanding the product portfolio and stimulating market demand across passenger and commercial vehicle segments. The policy framework also encourages collaborations between energy suppliers and automotive OEMs, fostering innovation in fuel storage solutions and stations.

Policy Incentives Driving Adoption: Governments worldwide are introducing tax credits, low‑emission vehicle mandates, and preferential registration fees to encourage the shift toward cleaner fuels. These policy incentives reduce overall ownership costs and create a favorable regulatory environment for manufacturers and fleet operators. As a result, automakers are accelerating the development of CNG and LPG models, while corporate buyers are reconsidering fuel choices to align with sustainability goals, boosting market momentum. Incentives also spur joint ventures, speeding station rollout and lowering ownership costs for users.

Why does Asia Pacific Dominate the Global CNG and LPG Vehicle Market? |@12
AGC3x.webp
Aisin3x.webp
ASKA P Co. LTD3x.webp
BD3x.webp
BILL & MELIDA3x.webp
BOSCH3x.webp
CHUNGHWA TELECOM3x.webp
DAIKIN3x.webp
DEPARTMENT OF SCIENCE & TECHNOLOGY3x.webp
ETRI3x.webp
Fiti Testing3x.webp
GERRESHEIMER3x.webp
HENKEL3x.webp
HITACHI3x.webp
HOLISTIC MEDICAL CENTRE3x.webp
Institute for information industry3x.webp
JAXA3x.webp
JTI3x.webp
Khidi3x.webp
METHOD.3x.webp
Missul E&S3x.webp
MITSUBISHI3x.webp
MIZUHO3x.webp
NEC3x.webp
Nippon steel3x.webp
NOVARTIS3x.webp
Nttdata3x.webp
OSSTEM3x.webp
PALL3x.webp
Panasonic3x.webp
RECKITT3x.webp
Rohm3x.webp
RR KABEL3x.webp
SAMSUNG ELECTRONICS3x.webp
SEKISUI3x.webp
Sensata3x.webp
SENSEAIR3x.webp
Soft Bank Group3x.webp
SYSMEX3x.webp
TERUMO3x.webp
TOYOTA3x.webp
UNDP3x.webp
Unilever3x.webp
YAMAHA3x.webp
Yokogawa3x.webp

Want to customize this report? This report can be personalized according to your needs. Our analysts and industry experts will work directly with you to understand your requirements and provide you with customized data in a short amount of time. We offer $1000 worth of FREE customization at the time of purchase.

Feedback From Our Clients


