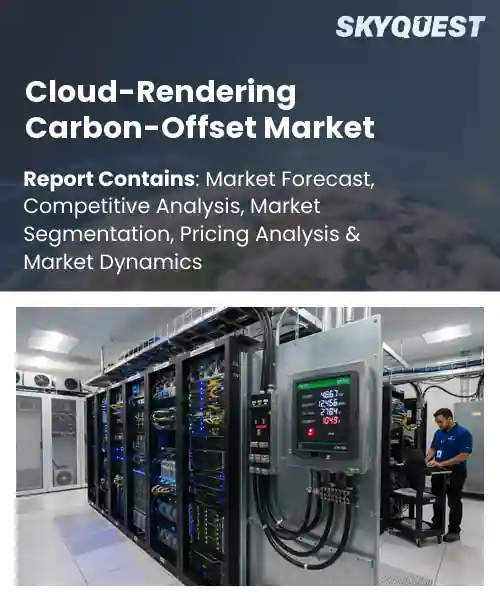
Cloud-Rendering Carbon-Offset Market
Report ID: SQMIG45E3177
Report ID: SQMIG45E3177
[email protected]
USA +1 351-333-4748
Report ID:
SQMIG45E3177 |
Region:
Global |
Published Date: August, 2026
Pages:
157
|Tables:
146
|Figures:
78


Global Cloud-Rendering Carbon-Offset Market size was valued at USD 128.4 Million in 2024 and is poised to grow from USD 146.63 Million in 2025 to USD 424.19 Million by 2033, growing at a CAGR of 14.2% during the forecast period (2026-2033).
The cloud‑rendering carbon‑offset market emerges at the intersection of graphics processing and sustainability accounting. As studios and game developers shift heavy rendering workloads to GPU farms, the electricity they consume becomes a measurable source of emissions. Regulators and investors have begun demanding accounting, which compels providers to purchase or generate carbon credits that neutralize the power draw. Early adopters such as Epic Games and Nvidia’s RTX Cloud have publicly disclosed offset purchases, establishing a precedent that transforms a cost center into a reputational asset. This evolution from ad‑hoc mitigation to a marketplace reflects growing climate‑risk awareness within the entertainment sector. The catalyst driving market growth is the convergence of rendering pipelines with pledges, forcing providers to embed carbon accounting into contracts. When a studio hires a cloud‑render farm, the provider calculates kilowatt‑hours, converts them to CO₂ equivalents, and acquires matching offsets. This creates a revenue stream for offset generators, particularly projects that blend certificates with reforestation near data‑center hubs such as Iceland’s geothermal farms. As creators adopt ray tracing, GPU demand spikes, prompting vendors to differentiate by offering offset solutions that simplify ESG reporting. Firms that integrate blockchain traceability or API‑driven purchase mechanisms are poised to capture a market share.
How is AI-driven automation influencing carbon‑offset pricing in the cloud‑rendering market?
AI-driven automation is reshaping carbon‑offset pricing in cloud rendering by embedding real‑time emissions tracking into the rendering pipeline. Machine‑learning models predict energy consumption for each job, allowing platforms to allocate offset credits proportionally rather than using flat rates. This granular approach creates price signals that reflect true environmental impact, encouraging users to schedule workloads during low‑carbon periods. Automation also streamlines verification, reducing administrative overhead and making offset markets more liquid. As providers integrate these tools, the overall cost of offsets becomes more transparent, fostering greener decision‑making while maintaining the high performance demanded by media and gaming creators.In July 2025, RenderX announced an AI‑powered offset marketplace, demonstrating how automated pricing can boost market efficiency and support broader adoption of sustainable cloud‑rendering practices.
Market snapshot - (2026-2033)
Global Market Size
USD 128.4 Million
Largest Segment
Renewable Energy Credits
Fastest Growth
Carbon Removal Credits
Growth Rate
14.2% CAGR
To get more insights on this market click here to Request a Free Sample Report
Global cloud-rendering carbon-offset market is segmented by offset type, rendering workload, cloud deployment, carbon accounting method, end user and region. Based on offset type, the market is segmented into Carbon Removal Credits, Avoidance Credits and Renewable Energy Credits. Based on rendering workload, the market is segmented into 3D Rendering, Video Rendering, Visual Effects Rendering and Simulation Rendering. Based on cloud deployment, the market is segmented into Public Cloud, Private Cloud and Hybrid Cloud. Based on carbon accounting method, the market is segmented into Emissions Measurement, Carbon Footprint Estimation and Offset Matching. Based on end user, the market is segmented into Media & Entertainment, Architecture & Design, Gaming and Engineering & Simulation. Based on region, the market is segmented into North America, Europe, Asia Pacific, Latin America and Middle East & Africa.
Carbon Removal Credits segment dominates because stakeholders prioritize tangible climate impact over indirect mitigation. Render farms with high energy consumption seek verifiable removal to align with corporate sustainability pledges, and providers bundle these credits with compute services to enhance buyer confidence. The credibility of measured sequestration, coupled with emerging certification schemes, creates a compelling value proposition that steers purchasing decisions toward removal rather than avoidance or renewable energy alternatives.
However, Avoidance Credits segment is witnessing the strongest growth momentum as more render providers integrate real time emissions monitoring that ties to operational efficiencies. Regulatory encouragement for low carbon computing and client pressure for transparent reporting fuel demand for avoidance solutions, expanding market reach and creating revenue streams for cloud services.
3D Rendering segment dominates because the bulk of cloud rendering demand originates from visualisation pipelines that require photorealistic asset generation. Studios and designers rely on high fidelity images to secure funding and client approval, prompting them to allocate the majority of compute budgets to 3D workloads. This intense usage translates into larger carbon footprints, making 3D rendering the primary driver of offset procurement decisions across the market.
Meanwhile, Visual Effects Rendering segment is emerging as a high growth area as media experiences demand complex compositing and real time integration. GPU acceleration and AI driven asset generation lower costs, encouraging post production houses to move projects to the cloud. This surge expands offset needs and creates opportunities for carbon neutral service bundles.
To get detailed segments analysis, Request a Free Sample Report
North America leads through a combination of advanced digital infrastructure, deep integration of sustainability standards within creative industries, and a robust ecosystem of technology providers and carbon mitigation services. The region benefits from early adoption of cloud‑rendering platforms that embed offset mechanisms, supported by strong policy frameworks that incentivize climate‑positive investments. Collaborative networks linking studios, cloud operators, and environmental NGOs create transparent offset verification pathways, reinforcing market confidence. Additionally, a culture of innovation and high‑value content production sustains demand for efficient, low‑carbon rendering solutions, positioning North America as the benchmark for market practices worldwide.
United States Cloud-Rendering Carbon-Offset Market
Cloud-Rendering Carbon-Offset Market activity in the United States is driven by a convergence of leading cloud service providers, pioneering sustainability certifications, and a vibrant entertainment sector that prioritizes environmentally responsible production. Industry alliances promote standardized offset protocols, while academic research fuels continuous improvement in energy‑efficient rendering algorithms. Government incentives encourage investment in renewable energy for data centers, reinforcing the market’s credibility and encouraging broader adoption across studios of all sizes.
Canada Cloud-Rendering Carbon-Offset Market
Cloud-Rendering Carbon-Offset Market development in Canada is shaped by a strong commitment to clean energy and a collaborative approach between technology firms and public agencies. National strategies emphasize carbon neutrality for digital infrastructure, prompting data center operators to integrate offset schemes directly into service offerings. Creative enterprises benefit from transparent reporting tools that align with Canadian environmental policies, fostering trust and accelerating market uptake among independent producers and larger studios alike.
Europe’s rapid expansion stems from cohesive regulatory environments, ambitious climate commitments, and a mature media landscape that values sustainability as a core brand attribute. Cross‑border initiatives harmonize offset standards, enabling seamless service provision across diverse jurisdictions. Leading studios and cloud providers actively embed carbon‑offset options into workflow platforms, responding to heightened stakeholder expectations for responsible production. Strong research institutions contribute cutting‑edge efficiency technologies, while government‑backed green financing mechanisms lower barriers for adoption, collectively propelling Europe to the forefront of market growth.
Germany Cloud-Rendering Carbon-Offset Market
Cloud-Rendering Carbon-Offset Market progress in Germany benefits from a well‑established renewable energy grid and a strong engineering tradition that emphasizes precision and efficiency. Collaborative consortia link manufacturers, cloud operators, and environmental auditors to create transparent offset verification processes. Business culture that prizes environmental stewardship drives studios to select providers with robust carbon‑neutral credentials, reinforcing Germany’s position as a dominant European hub for sustainable rendering services.
United Kingdom Cloud-Rendering Carbon-Offset Market
Cloud-Rendering Carbon-Offset Market momentum in the United Kingdom is fueled by a dynamic creative sector that actively embraces green credentials to differentiate content. Policy frameworks promote carbon accounting for digital services, encouraging cloud platforms to embed offset choices within pricing models. Partnerships between tech startups and established studios foster innovative offset solutions, while public awareness campaigns amplify demand for environmentally responsible production practices, establishing the United Kingdom as the fastest‑growing market within Europe.
France Cloud-Rendering Carbon-Offset Market
Cloud-Rendering Carbon-Offset Market emergence in France is characterized by a cultural emphasis on artistic innovation coupled with a national commitment to ecological transition. Film and gaming studios increasingly demand carbon‑offset integration as a standard service, prompting cloud providers to develop tailored sustainability packages. Government incentives for low‑carbon digital infrastructure further stimulate market participation, positioning France as an emerging leader in the European offset ecosystem.
Asia Pacific is strengthening its role by leveraging rapid digital adoption, burgeoning creative industries, and a growing focus on climate responsibility across the region. Strategic investments in renewable‑powered data centers and collaborative standards initiatives enhance the credibility of offset offerings. Regional cloud providers are integrating carbon‑offset options directly into service catalogs, responding to client demand for greener production pipelines. Educational programs and industry forums promote best practices, while government directives encourage carbon accounting for digital services, collectively advancing the region’s influence in the global market.
Japan Cloud-Rendering Carbon-Offset Market
Cloud-Rendering Carbon-Offset Market activity in Japan is propelled by a high‑tech manufacturing heritage and a strong policy push toward low‑carbon digital services. Major cloud operators align their infrastructure with national renewable energy targets, embedding offset mechanisms into rendering workflows. Creative studios value the transparency offered by Japanese certification bodies, fostering trust and encouraging wider adoption of carbon‑neutral rendering solutions.
South Korea Cloud-Rendering Carbon-Offset Market
Cloud-Rendering Carbon-Offset Market growth in South Korea is driven by an agile tech ecosystem and government incentives that prioritize sustainable data center operations. Partnerships between cloud platforms and local environmental organizations create customized offset products for the entertainment sector. The emphasis on innovation and rapid deployment of green technologies positions South Korea as a key contributor to regional market expansion.
To know more about the market opportunities by region and country, click here to
Buy The Complete Report
Increasing Adoption Of Sustainable Practices
Enterprises seeking to reduce their environmental impact are shifting toward cloud‑rendering solutions that incorporate carbon‑offset mechanisms, because these services align with corporate sustainability goals and stakeholder expectations. This shift creates demand for providers that can certify emissions reductions, integrate offset purchases seamlessly, and report impact transparently. As organizations prioritize green credentials, they are more likely to select platforms that demonstrate measurable carbon mitigation, thereby expanding the market for cloud‑rendering carbon‑offset offerings and encouraging further innovation in verification and reporting processes.
Regulatory Incentives Encouraging Green Computing
Governments across major economies are introducing policies that reward organizations for lowering digital carbon footprints, including tax credits, subsidies, and preferential procurement for services that demonstrate verified offsets. These incentives lower the effective cost of adopting carbon‑neutral cloud‑rendering platforms and make sustainability a competitive advantage. Companies respond by integrating offset‑enabled solutions into their production pipelines, accelerating demand for providers that can meet compliance requirements and deliver documented emissions reductions, thereby propelling market expansion through policy‑driven adoption in the broader technology sector.
Uncertainty Around Carbon Credit Validity
Stakeholders often question the reliability of carbon credits due to variations in verification standards, double‑counting concerns, and limited transparency in offset projects. This uncertainty makes organizations hesitant to commit substantial budgets to cloud‑rendering services that embed offset purchases, fearing reputational risk if offsets are later deemed ineffective. As a result, potential customers may delay adoption, seek alternative sustainability solutions, or demand higher assurance, which slows market traction and pressures providers to invest in more rigorous certification processes before scaling offerings.
High Energy Consumption Of Rendering Farms
Large‑scale rendering farms require significant electricity, often sourced from grids with mixed renewable and fossil fuel mixes, which can offset the intended carbon‑neutral benefits of cloud‑rendering offsets. When the underlying energy profile remains carbon‑intensive, organizations view offsetting as a partial solution rather than a comprehensive sustainability strategy. This perception leads to scrutiny of offset claims, demands for greener energy sourcing, and potential preference for on‑premise solutions with tighter energy control, thereby constraining market growth until energy consumption patterns improve significantly.
Request Free Customization of this report to help us to meet your business objectives.
The market is shaped by tech giants forming large‑scale purchase agreements and startups leveraging partnerships to embed carbon‑offset services into rendering pipelines; Google’s $915 million commitment to carbon removal and the Carbon to Value Initiative’s Year 5 startup pilots illustrate how M&A, strategic alliances and rapid tech integration are driving competitive advantage in cloud‑rendering offset solutions.
Top Player’s Company Profile
Recent Developments
SkyQuest’s ABIRAW (Advanced Business Intelligence, Research & Analysis Wing) is our Business Information Services team that Collects, Collates, Correlates, and Analyses the Data collected by means of Primary Exploratory Research backed by robust Secondary Desk research. As per SkyQuest analysis, the cloud‑rendering carbon‑offset market is being propelled primarily by the growing adoption of sustainable practices as enterprises seek to align high‑performance GPU workloads with ESG goals, while a second strong catalyst comes from regulatory incentives that reward green computing through tax credits and preferential procurement. The market’s pace is tempered by uncertainty around carbon‑credit validity, which makes some buyers hesitant to commit fully. North America leads the landscape, offering the most advanced infrastructure and a supportive policy environment, and the carbon‑removal credit segment commands the largest share as providers prioritize verifiable climate impact over avoidance or renewable‑energy credits.
| Report Metric | Details |
|---|---|
| Market size value in 2024 | USD 128.4 Million |
| Market size value in 2033 | USD 424.19 Million |
| Growth Rate | 14.2% |
| Base year | 2024 |
| Forecast period | (2026-2033) |
| Forecast Unit (Value) | USD Million |
| Segments covered |
|
| Regions covered | North America (US, Canada), Europe (Germany, France, United Kingdom, Italy, Spain, Rest of Europe), Asia Pacific (China, India, Japan, Rest of Asia-Pacific), Latin America (Brazil, Rest of Latin America), Middle East & Africa (South Africa, GCC Countries, Rest of MEA) |
| Companies covered |
|
| Customization scope | Free report customization with purchase. Customization includes:-
|
To get a free trial access to our platform which is a one stop solution for all your data requirements for quicker decision making. This platform allows you to compare markets, competitors who are prominent in the market, and mega trends that are influencing the dynamics in the market. Also, get access to detailed SkyQuest exclusive matrix.
Table Of Content
Executive Summary
Market overview
Parent Market Analysis
Market overview
Market size
KEY MARKET INSIGHTS
COVID IMPACT
MARKET DYNAMICS & OUTLOOK
Market Size by Region
KEY COMPANY PROFILES
Methodology
For the Cloud-Rendering Carbon-Offset Market, our research methodology involved a mixture of primary and secondary data sources. Key steps involved in the research process are listed below:
1. Information Procurement: This stage involved the procurement of Market data or related information via primary and secondary sources. The various secondary sources used included various company websites, annual reports, trade databases, and paid databases such as Hoover's, Bloomberg Business, Factiva, and Avention. Our team did 45 primary interactions Globally which included several stakeholders such as manufacturers, customers, key opinion leaders, etc. Overall, information procurement was one of the most extensive stages in our research process.
2. Information Analysis: This step involved triangulation of data through bottom-up and top-down approaches to estimate and validate the total size and future estimate of the Cloud-Rendering Carbon-Offset Market.
3. Report Formulation: The final step entailed the placement of data points in appropriate Market spaces in an attempt to deduce viable conclusions.
4. Validation & Publishing: Validation is the most important step in the process. Validation & re-validation via an intricately designed process helped us finalize data points to be used for final calculations. The final Market estimates and forecasts were then aligned and sent to our panel of industry experts for validation of data. Once the validation was done the report was sent to our Quality Assurance team to ensure adherence to style guides, consistency & design.
Analyst Support
Customization Options
With the given market data, our dedicated team of analysts can offer you the following customization options are available for the Cloud-Rendering Carbon-Offset Market:
Product Analysis: Product matrix, which offers a detailed comparison of the product portfolio of companies.
Regional Analysis: Further analysis of the Cloud-Rendering Carbon-Offset Market for additional countries.
Competitive Analysis: Detailed analysis and profiling of additional Market players & comparative analysis of competitive products.
Go to Market Strategy: Find the high-growth channels to invest your marketing efforts and increase your customer base.
Innovation Mapping: Identify racial solutions and innovation, connected to deep ecosystems of innovators, start-ups, academics, and strategic partners.
Category Intelligence: Customized intelligence that is relevant to their supply Markets will enable them to make smarter sourcing decisions and improve their category management.
Public Company Transcript Analysis: To improve the investment performance by generating new alpha and making better-informed decisions.
Social Media Listening: To analyze the conversations and trends happening not just around your brand, but around your industry as a whole, and use those insights to make better Marketing decisions.
REQUEST FOR SAMPLE
 REQUEST FREE CUSTOMIZATION


Want to customize this report? This report can be personalized according to your needs. Our analysts and industry experts will work directly with you to understand your requirements and provide you with customized data in a short amount of time. We offer $1000 worth of FREE customization at the time of purchase.
Feedback From Our Clients


 USA (+1) 351-333-4748

