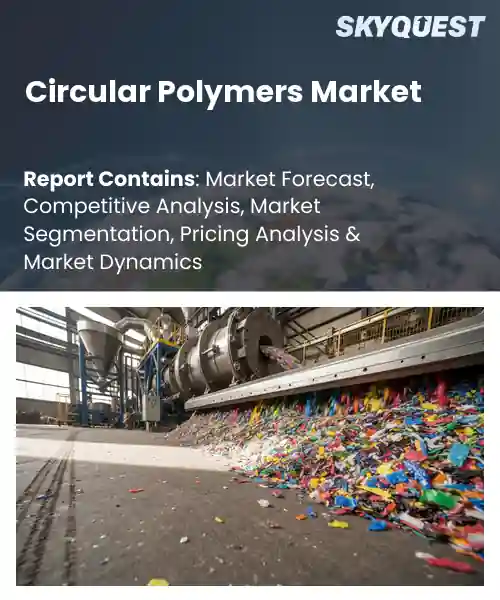
Circular Polymers Market
Report ID: SQMIG15E3514
Report ID: SQMIG15E3514
[email protected]
USA +1 351-333-4748
Report ID:
SQMIG15E3514 |
Region:
Global |
Published Date: May, 2026
Pages:
157
|Tables:
118
|Figures:
77


Global Circular Polymers Market size was valued at USD 8.52 Billion in 2024 and is poised to grow from USD 9.76 Billion in 2025 to USD 28.85 Billion by 2033, growing at a CAGR of 14.52% during the forecast period (2026-2033).
The primary driver of the circular polymers market is regulatory and corporate pressure to decouple plastic use from virgin fossil feedstocks, reshaping industry priorities over the last decade. Circular polymers are materials recovered, recycled or chemically reclaimed to re-enter production cycles, and they matter because they reduce resource depletion, lower lifecycle emissions and respond to consumer demand for sustainable products. Historically firms moved from linear take-make-waste models toward collection, mechanical recycling and emerging chemical recycling technologies, seen in PET bottle-to-bottle initiatives and automaker programs reclaiming interior plastics. These shifts created investment in sorting infrastructure and collaborations across value chains globally.A key factor accelerating global circular polymers market growth is improving economics driven by technology and scale, which produces virtuous cycle. As advanced sorting, mechanical upgrades and chemical recycling lower contamination and raise yield, manufacturers can meet recycled-content mandates and brand commitments at acceptable cost, so demand from packaging, automotive and textile sectors grows. For example, beverage companies adopting bottle-to-bottle PET and sports brands using ocean-plastic sneakers create secured feedstock streams that attract investment in collection and infrastructure. Consequently higher throughput reduces unit costs, enabling broader substitution of virgin resin and opening opportunities for product differentiation and carbon reduction claims.
How is blockchain enhancing traceability in the circular polymers market?
Blockchain strengthens traceability in the circular polymers market by providing an immutable shared ledger that records material origin and every processing step. Key aspects include digital product passports that bundle verified supplier attestations and lab fingerprints, chain of custody records that follow material through sorting and recycling, and public audit ready entries that deter fraud. Today the market is moving from pilots to scaled use because brands and regulators demand verifiable recyclate claims and because traceability raises confidence in higher value secondary polymers. Practical examples include QR enabled passports and lab linked fingerprints that connect waste streams to finished parts.Circularise March 2026, the PRecycling project concluded a four year proof of concept using blockchain linked digital product passports to certify recyclate quality and produce audit ready chain of custody records, supporting smoother compliance and greater commercial trust in recycled polymers.
Market snapshot - (2026-2033)
Global Market Size
USD 8.52 Billion
Largest Segment
Recycled PET
Fastest Growth
Chemically Recycled Plastics
Growth Rate
14.52% CAGR
To get more insights on this market click here to Request a Free Sample Report
Global circular polymers market is segmented by polymer type, process, application, end-use and region. Based on polymer type, the market is segmented into Recycled PET, Recycled Polyethylene, Recycled Polypropylene and Chemically Recycled Plastics. Based on process, the market is segmented into Mechanical Recycling, Chemical Recycling (Depolymerization) and Dissolution Recycling. Based on application, the market is segmented into Packaging, Textiles and Automotive. Based on end-use, the market is segmented into Food & Beverage Packaging, Non-Food Packaging and Industrial. Based on region, the market is segmented into North America, Europe, Asia Pacific, Latin America and Middle East & Africa.
How does recycled PET shape material performance and adoption in the circular polymers market? |@12
Recycled PET segment dominates because reliable post-consumer bottle feedstocks, mature collection and sorting infrastructures, and well-established processing routes create consistent, high-quality recyclates that meet demanding packaging and textile performance requirements. Its favorable clarity and barrier properties reduce reformulation risk for brands, while extensive industry experience and certification pathways lower technical and commercial barriers, driving steady integration into mainstream supply chains and reinforcing market preference.
However, Chemically Recycled Plastics are witnessing the strongest growth momentum as depolymerization and advanced conversion routes unlock high-purity outputs from mixed or contaminated waste streams, enabling use in quality-sensitive applications. Regulatory emphasis on recycled content, rising corporate commitments, and accelerating technology investments expand application scope and stimulate new commercial partnerships, catalyzing rapid future opportunity creation across value chains.
What role does chemical recycling depolymerization play in circular polymers market feedstock supply? |@12
Chemical Recycling (Depolymerization) segment dominates because it transforms complex and contaminated polymer waste into near-virgin monomers suitable for high-spec applications, addressing limitations of conventional mechanical recycling. This capability reduces reliance on fossil feedstocks, aligns with regulatory and corporate recycled content goals, and attracts capital and strategic partnerships that build depolymerization capacity and integrate recovered monomers into resilient, higher-value circular supply chains.
However, Dissolution Recycling is emerging as the most rapidly expanding area as solvent-based recovery preserves polymer integrity from multilayer and blended materials, producing high-quality recyclates for sensitive end uses. Improvements in continuous processing and increasing commercial demonstrations shorten the path to scale, unlocking new circular feedstock routes and expanding downstream product opportunities.
To get detailed segments analysis, Request a Free Sample Report
Why does Europe Dominate the Global Circular Polymers Market? |@12
Europe dominates the global circular polymers market due to a mature policy environment, advanced recycling infrastructure and a deep industrial ecosystem that supports upstream and downstream circularity. Strict regulatory frameworks and extended producer responsibility mechanisms have incentivized adoption of recycled content and closed loop initiatives across sectors. Strong collaboration between manufacturers, research institutions and waste management firms accelerates innovation in collection, sorting and chemical recycling technologies. Market actors benefit from integrated supply chains, established standards and consumer preference for sustainable materials, which together reduce entry barriers for circular solutions. Public and private investment, combined with regional trade connectivity and technical expertise, sustain steady improvement in feedstock availability and product quality, reinforcing Europe position as a leading hub for circular polymer development and commercialization.
Germany Circular Polymers Market |@12
Circular Polymers Market in Germany is driven by strong industrial engineering capability, advanced chemical and mechanical recycling expertise and close collaboration between automotive and packaging manufacturers. Policymaker support and established logistics networks enable efficient feedstock collection and material recovery. Research institutions and consortiums focus on process optimization and material performance, while brand owners prioritize recycled content and supply chain traceability, reinforcing Germany role as a leader in circular polymer solutions.
United Kingdom Circular Polymers Market |@12
Circular Polymers Market in United Kingdom benefits from proactive regulation, mature waste management networks and an innovation ecosystem focused on material recovery and product redesign. Retailers and manufacturers drive demand for recycled content while technology providers develop scalable sorting and depolymerization methods. Collaboration among academia, industry and policymakers supports standards and certifications, enabling brand confidence and market uptake. Logistics and investment appetite accelerate transition of pilot solutions into commercial practice.
France Circular Polymers Market |@12
Circular Polymers Market in France is influenced by a strong chemical industry emphasizing packaging sustainability, prompting demand for recycled and bio based polymers. Industrial clusters enable collaboration among manufacturers, recyclers and researchers to improve sorting and polymer upcycling. Policy frameworks and corporate sustainability programs encourage closed loop initiatives, while design for recycling and producer engagement strengthen material quality and supply consistency, making France a receptive market for circular polymer innovation.
What is Driving the Rapid Expansion of Circular Polymers Market in North America? |@12
North America expansion in circular polymers is driven by dynamic private sector engagement, strong corporate sustainability commitments and a growing technology ecosystem delivering scalable recycling solutions. Major brand owners and manufacturers are prioritizing recycled content to meet consumer expectations and differentiate products, while investors and startups accelerate development of novel mechanical and chemical recycling processes. Infrastructure modernization efforts and cross sector partnerships improve feedstock collection and material recovery, enabling higher quality secondary polymers. Policy initiatives at subnational levels complement private action by creating market signals and procurement incentives. Supply chain collaboration, combined with logistics capabilities and access to processing expertise, supports commercialization of circular polymer technologies and rapid deployment across packaging, automotive and other high demand end use sectors and industrial applications.
United States Circular Polymers Market |@12
Circular Polymers Market in United States reflects strong corporate sustainability commitments and a vibrant technology landscape advancing mechanical and chemical recycling. Major brands and manufacturers collaborate with recyclers and technology providers to secure recycled feedstock and enhance material performance. State level policies and procurement programs create demand signals while logistics networks and industrial capacity enable scale. Cross sector collaboration and startup innovation drive commercialization across packaging, automotive and industrial applications.
Canada Circular Polymers Market |@12
Circular Polymers Market in Canada is influenced by public initiatives and extended producer responsibility, with packaging and industrial manufacturers engaging to increase recycled content. Regional recycling and sorting infrastructure investments improve feedstock quality and enable advanced recycling. Collaboration among provincial agencies, research institutions and industry supports standards and projects. Focus on traceability, material certification and sustainable procurement enhances market confidence and promotes uptake across consumer and industrial end uses.
How is Asia Pacific Strengthening its Position in Circular Polymers Market? |@12
Asia Pacific is strengthening its position in the circular polymers market through targeted industrial strategies, technology adoption and closer collaboration between manufacturers and recycling specialists. Advanced material science capabilities and strong manufacturing clusters enable rapid integration of recycled polymers into high value applications such as electronics and automotive components. Governments and industry groups support pilot projects and standards development that enhance collection, sorting and processing efficiency. Investment in chemical recycling and polymer upcycling technologies complements mechanical recycling, expanding feedstock flexibility. Regional supply chain integration, export oriented manufacturing and consumer demand for sustainable products further incentivize upstream and downstream actors. Continued focus on research commercialization and public private partnerships is enhancing quality, traceability and market acceptance of circular polymer solutions across Asia Pacific.
Japan Circular Polymers Market |@12
Circular Polymers Market in Japan is propelled by advanced material science, manufacturing and collaboration between electronics, automotive and chemical sectors. Industry invests in polymer innovation, chemical recycling and design for recycling to meet product quality requirements. Local collection systems and industrial recycling initiatives support feedstock reliability, while industry standards and certification enhance trust in recycled materials. Close ties between research institutes and manufacturers accelerate commercialization of value circular polymer applications.
South Korea Circular Polymers Market |@12
Circular Polymers Market in South Korea is supported by strong petrochemical sector, industry leadership and coordinated government programs to scale recycling and innovation. Electronics and automotive manufacturers prioritize recycled polymers for performance applications, while research centers advance depolymerization and upcycling methods. Efficient waste collection systems and industry alliances improve feedstock flow and quality. Policy focus on circular economy measures and industrial collaboration enhances trust and broader adoption of recycled plastics.
To know more about the market opportunities by region and country, click here to
Buy The Complete Report
Drivers |@12
Policy Support and Incentives
Technological Advancements and Innovation
Restraints |@12
Feedstock Availability and Quality
High Processing and Collection Costs
Request Free Customization of this report to help us to meet your business objectives.
Competitive landscape in the global circular polymers market is defined by partnership and consolidation strategies that secure feedstock and market access, with examples such as SABIC partnering with Plastic Energy, LyondellBasell launching Circulen products, and Ascend acquiring a majority stake in Circular Polymers; these moves pressure rivals to accelerate technology innovation, licensing and joint ventures to qualify circular resins for brand supply chains.
Top Player’s Company Profile
Recent Developments
SkyQuest’s ABIRAW (Advanced Business Intelligence, Research & Analysis Wing) is our Business Information Services team that Collects, Collates, Correlates, and Analyses the Data collected by means of Primary Exploratory Research backed by robust Secondary Desk research. As per SkyQuest analysis, the global circular polymers market is being propelled primarily by regulatory and corporate pressure to reduce reliance on virgin fossil feedstocks, and further accelerated by improving economics from technology and scale that enhance sorting and recycling yields. However inconsistent feedstock availability and variable quality remain a major restraint, increasing processing complexity and costs for converters. Europe leads the market due to mature policy frameworks and advanced recycling infrastructure, while recycled PET remains the dominant segment because of reliable bottle feedstocks and established bottle-to-bottle pathways. Cross sector partnerships and traceability initiatives are scaling solutions but require sustained investment and standardized collection to fully materialize.
| Report Metric | Details |
|---|---|
| Market size value in 2024 | USD 8.52 Billion |
| Market size value in 2033 | USD 28.85 Billion |
| Growth Rate | 14.52% |
| Base year | 2024 |
| Forecast period | (2026-2033) |
| Forecast Unit (Value) | USD Billion |
| Segments covered |
|
| Regions covered | North America (US, Canada), Europe (Germany, France, United Kingdom, Italy, Spain, Rest of Europe), Asia Pacific (China, India, Japan, Rest of Asia-Pacific), Latin America (Brazil, Rest of Latin America), Middle East & Africa (South Africa, GCC Countries, Rest of MEA) |
| Companies covered |
|
| Customization scope | Free report customization with purchase. Customization includes:-
|
To get a free trial access to our platform which is a one stop solution for all your data requirements for quicker decision making. This platform allows you to compare markets, competitors who are prominent in the market, and mega trends that are influencing the dynamics in the market. Also, get access to detailed SkyQuest exclusive matrix.
Table Of Content
Executive Summary
Market overview
Parent Market Analysis
Market overview
Market size
KEY MARKET INSIGHTS
COVID IMPACT
MARKET DYNAMICS & OUTLOOK
Market Size by Region
KEY COMPANY PROFILES
Methodology
For the Circular Polymers Market, our research methodology involved a mixture of primary and secondary data sources. Key steps involved in the research process are listed below:
1. Information Procurement: This stage involved the procurement of Market data or related information via primary and secondary sources. The various secondary sources used included various company websites, annual reports, trade databases, and paid databases such as Hoover's, Bloomberg Business, Factiva, and Avention. Our team did 45 primary interactions Globally which included several stakeholders such as manufacturers, customers, key opinion leaders, etc. Overall, information procurement was one of the most extensive stages in our research process.
2. Information Analysis: This step involved triangulation of data through bottom-up and top-down approaches to estimate and validate the total size and future estimate of the Circular Polymers Market.
3. Report Formulation: The final step entailed the placement of data points in appropriate Market spaces in an attempt to deduce viable conclusions.
4. Validation & Publishing: Validation is the most important step in the process. Validation & re-validation via an intricately designed process helped us finalize data points to be used for final calculations. The final Market estimates and forecasts were then aligned and sent to our panel of industry experts for validation of data. Once the validation was done the report was sent to our Quality Assurance team to ensure adherence to style guides, consistency & design.
Analyst Support
Customization Options
With the given market data, our dedicated team of analysts can offer you the following customization options are available for the Circular Polymers Market:
Product Analysis: Product matrix, which offers a detailed comparison of the product portfolio of companies.
Regional Analysis: Further analysis of the Circular Polymers Market for additional countries.
Competitive Analysis: Detailed analysis and profiling of additional Market players & comparative analysis of competitive products.
Go to Market Strategy: Find the high-growth channels to invest your marketing efforts and increase your customer base.
Innovation Mapping: Identify racial solutions and innovation, connected to deep ecosystems of innovators, start-ups, academics, and strategic partners.
Category Intelligence: Customized intelligence that is relevant to their supply Markets will enable them to make smarter sourcing decisions and improve their category management.
Public Company Transcript Analysis: To improve the investment performance by generating new alpha and making better-informed decisions.
Social Media Listening: To analyze the conversations and trends happening not just around your brand, but around your industry as a whole, and use those insights to make better Marketing decisions.
REQUEST FOR SAMPLE
 REQUEST FREE CUSTOMIZATION


Want to customize this report? This report can be personalized according to your needs. Our analysts and industry experts will work directly with you to understand your requirements and provide you with customized data in a short amount of time. We offer $1000 worth of FREE customization at the time of purchase.
Feedback From Our Clients


 USA (+1) 351-333-4748

