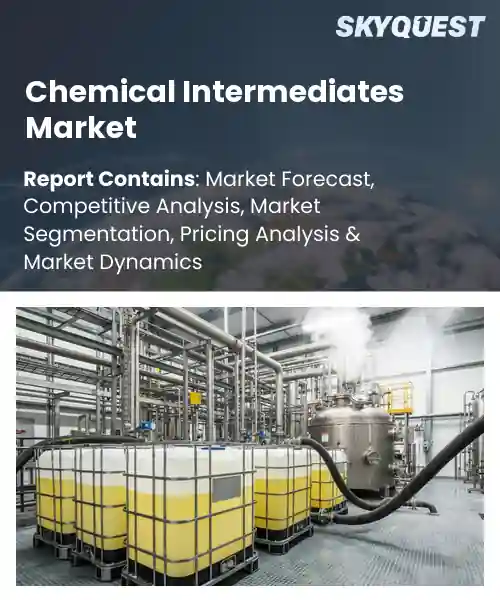
Chemical Intermediates Market
Report ID: SQMIG15E3397
Report ID: SQMIG15E3397
[email protected]
USA +1 351-333-4748
Report ID:
SQMIG15E3397 |
Region:
Global |
Published Date: April, 2026
Pages:
157
|Tables:
122
|Figures:
77


Global Chemical Intermediates Market size was valued at USD 124.8 Billion in 2024 and is poised to grow from USD 131.16 Billion in 2025 to USD 125.3 Billion by 2033, growing at a CAGR of 5.1% during the forecast period (2026-2033).
The primary driver of the chemical intermediates market is accelerating downstream demand from diversified end use industries, which elevates the market’s strategic importance as a nexus between raw materials and finished products. Chemical intermediates comprise molecules such as ethylene oxide, phthalic anhydride and adipic acid that enable production of plastics, pigments and pharmaceuticals; their availability shapes supply chains and costs. Over past decades the sector has transitioned from regionalized commodity production toward integrated global networks, exemplified by petrochemical hubs in US Gulf Coast and the Middle East, while Asia Pacific’s capacity growth has shifted trade flows and pricing dynamics internationally.Building on the sector’s global integration, a dominant factor shaping future growth is regulatory pressure for sustainability, which compels producers to innovate and supply lower carbon or biobased intermediates that meet lifecycle targets. As regulations restrict volatile organic compounds and mandate lower carbon footprints, manufacturers invest in catalytic processes and fermentation routes that allow firms to replace traditional phthalates with biobased plasticizers in consumer goods and to feed greener building blocks into pharmaceutical synthesis. This transition raises product differentiation and incentivizes plant retrofits, fosters chemical and biotech partnerships and effectively converts environmental policy into commercial demand across global supply chains.
How is AI enhancing process optimization in the chemical intermediates market?
AI improves process optimization in the chemical intermediates market by applying machine learning, advanced analytics and digital twin approaches to reduce variability, improve quality and increase throughput. Key aspects include predictive maintenance, model based control and recipe optimization that close the gap between lab scale and production. The current state shows wider adoption of real time analytics in plants to stabilize batch operations and cut unplanned downtime. In a market where margins and supply reliability matter, these efficiency gains strengthen competitiveness and support more rapid commercialization. Examples range from AI guided catalyst selection to closed loop batch control that captures and replicates best performing runs.TwinThread March 2026, released Perfect Batch an AI analytics platform that identifies high performing runs and enables closed loop adjustments to reduce cycle variability and reveal hidden capacity thereby supporting operational efficiency and faster scaling in the chemical intermediates market.
Market snapshot - (2026-2033)
Global Market Size
USD 124.8 Billion
Largest Segment
Caustic Products & Chlor-Alkali Intermediates
Fastest Growth
Specialized C1-C4 Intermediates
Growth Rate
5.1% CAGR
To get more insights on this market click here to Request a Free Sample Report
Global chemical intermediates market is segmented by product category, material source, end-use industry, grade/purity and region. Based on product category, the market is segmented into Ethylene Amines & Propylene Derivatives, Caustic Products & Chlor-Alkali Intermediates, Aromatic Intermediates (Benzene, Toluene, Xylene) and Specialized C1-C4 Intermediates. Based on material source, the market is segmented into Petrochemical-based Intermediates, Bio-based & Sustainable Intermediates and Inorganic Chemical Intermediates. Based on end-use industry, the market is segmented into Pharmaceutical & Agrochemical Synthesis, Polymers, Resins & Plastics Manufacturing, Coatings, Adhesives & Sealants and Textile & Consumer Goods Chemicals. Based on grade/purity, the market is segmented into Technical/Industrial Grade and Pharmaceutical/High-Purity Grade. Based on region, the market is segmented into North America, Europe, Asia Pacific, Latin America and Middle East & Africa.
Aromatic Intermediates (Benzene, Toluene, Xylene) segment dominates because these core feedstocks underpin a wide range of downstream chemistries, from solvents and resins to polymer precursors and agrochemical building blocks. Their dominance is driven by established production infrastructure, reliable supply chains, and broad application versatility that creates consistent industrial demand and enables cost efficiencies through integration with large petrochemical complexes. Continuous innovation in processing and derivative development further secures their market primacy.
However, Specialized C1-C4 Intermediates are emerging as the most rapidly expanding area as they enable fine chemical syntheses, support light hydrocarbon derivatives for high-value uses, and benefit from modular production advances. Innovations in catalytic processes and application diversification accelerate adoption and unlock new opportunities across multiple industrial use cases.
Bio-based & Sustainable Intermediates segment stands out because shifting corporate sustainability commitments and tighter environmental regulations spur demand for renewable feedstocks and lower-carbon process routes. Investment in fermentation, enzymatic synthesis, and green separation technologies expands feasible product scopes, while brand and supply-chain commitments push buyers toward certified alternatives, creating durable market pull that reshapes procurement priorities and incentivizes incumbent producers to adopt circular and low-impact manufacturing models, and supports premium positioning.
Meanwhile, Inorganic Chemical Intermediates are growing fastest due to demand in advanced materials, catalysts, and water treatment chemistries and investments in high-purity manufacturing. Improvements in synthesis and purification expand application scopes and enable suppliers to offer tailored inorganic products that deliver performance benefits in diverse industrial formulations.
To get detailed segments analysis, Request a Free Sample Report
Asia Pacific commands the market through a convergence of integrated manufacturing ecosystems, abundant industrial clusters and deep downstream demand from electronics, automotive, consumer care and construction sectors. Regional strength stems from concentrated petrochemical complexes, strategic port infrastructure and established logistics corridors that support efficient feedstock movement and export orientation. A culture of technical collaboration between industry and research institutions accelerates specialty intermediate development and process optimization. Companies prioritize flexible production models, tailored customer service and investments in advanced production technologies, reinforcing cost competitiveness and product quality. Policy frameworks and skilled workforces further enable rapid scale up of capacity and supply resilience, while regional networks of suppliers and contract manufacturers facilitate fast time to market for novel intermediates. Strong focus on sustainability and incremental innovation further solidifies competitive advantage.
Chemical Intermediates Market in Japan centers on technical sophistication, specialty chemicals expertise and close industry research ties. Focused investment in precision manufacturing and rigorous quality assurance drives demand for intermediates used in electronics, pharmaceuticals and high performance coatings. Domestic firms emphasize process efficiency and safety standards while partnering with global suppliers to tailor formulations. A dense supplier network supports timely delivery and service, enabling adaptation to customer and regulatory requirements.
Chemical Intermediates Market in South Korea is driven by close integration between large petrochemical complexes and high tech manufacturing clusters, creating strong demand for performance intermediates. Industry emphasis on innovation, collaboration with electronics manufacturers and agile contract manufacturing supports customization. Firms prioritize environmental compliance and operational efficiency while leveraging efficient logistics and export networks. Strong engineering talent and technology partnerships help local producers deliver specialized formulations and technical support capability.
Expansion in North America is propelled by a combination of onshoring trends, robust downstream demand and targeted investments in specialty and high performance intermediates. Companies and contract manufacturers are expanding capacity closer to end markets to improve supply security and reduce lead times, while innovation hubs link chemical producers with pharmaceutical, agrochemical and advanced materials manufacturers. A focus on cleaner production techniques, circular feedstock solutions and regulatory alignment encourages investment in modernization and process intensification. Strategic partnerships, regional logistics networks and customer preference for local technical support further drive uptake. The market benefits from differentiated supply models offering tailored formulations, private label manufacturing and integrated technical services that support faster product introductions and application development. A skilled engineering and technical workforce combined with active collaboration between industry and research institutions accelerates commercialization of niche intermediates and supports customization for demanding applications.
Chemical Intermediates Market in United States is characterized by strong integration with pharmaceutical, specialty polymer and agrochemical value chains, driving demand for tailored intermediates and custom synthesis. Emphasis on advanced manufacturing, continuous processes and sustainability practices supports development of high purity and performance products. Large technical service networks and contract manufacturing organizations provide formulation support and scale capabilities. Close collaboration between industry, laboratories and universities accelerates innovation and application development.
Chemical Intermediates Market in Canada benefits from strong feedstock access, supportive regulatory frameworks and industrial clusters focused on clean chemistry and life sciences. Domestic and international firms leverage flexible manufacturing and technical service capabilities to supply specialty intermediates to end markets. Emphasis on environmental compliance, sustainable feedstock sourcing and collaboration with research institutes underpins product differentiation. Logistics infrastructure and proximity to export corridors facilitate reliable supply and tailored customer support.
Europe is reinforcing its role through a clear focus on sustainability, regulatory alignment and advancement of specialty and performance intermediates that meet stringent environmental and quality standards. Investment in circular feedstock strategies, greener production processes and decarbonization pathways encourages development of differentiated intermediates with lower lifecycle impact. Industrial clusters in the region support close collaboration between chemical manufacturers, automotive, pharmaceutical and materials sectors to co develop application specific solutions. Public policy and industry initiatives promote technology adoption, skills development and cross border supply chain resilience. Emphasis on high value, application driven products, backed by strong technical service capabilities and established export networks, allows European producers to compete on quality, compliance and technological differentiation. Digitalization, advanced process controls and partnerships with startups and research centres accelerate scale up and help manufacturers respond to evolving customer specifications while maintaining supply reliability.
Chemical Intermediates Market in Germany is anchored by strong industrial integration, advanced engineering capabilities and a deep focus on automotive and specialty material applications. Manufacturers emphasize process efficiency, high quality standards and environmental compliance to deliver performance intermediates. Collaboration between industry, research institutes and technology providers accelerates deployment of advanced process technologies. Well developed logistics and supplier networks support export oriented production and rapid technical service to industrial customers globally.
Chemical Intermediates Market in United Kingdom benefits from a strong pharmaceuticals and fine chemicals base, supported by vibrant research institutions and contract manufacturing. Firms focus on high value, application specific intermediates and scale up for clinical and specialty uses. Regulatory rigor and robust quality systems underpin product acceptance in demanding markets. Agile service models, technical support and industry collaboration enable tailored formulations and integration with downstream producers and supply chains.
Chemical Intermediates Market in France is driven by strong capabilities in pharmaceuticals, cosmetics and specialty materials, supported by advanced research expertise. Companies emphasize application driven development, green chemistry initiatives and close customer engagement to deliver tailored intermediates. Robust public private collaboration fosters technology transfer and scale testing. Well established supply chains and technical service offerings enable manufacturers to provide comprehensive formulation support, regulatory guidance and integration with downstream industrial partners.
To know more about the market opportunities by region and country, click here to
Buy The Complete Report
Expanding End-Use Industry Demand
Advances In Catalysts And Processes
Stringent Environmental Regulations Impacting Production
Feedstock Price Volatility Constraining Investments
Request Free Customization of this report to help us to meet your business objectives.
Competition in the global chemical intermediates market is intensifying as suppliers compete for low carbon feedstocks, proprietary platform molecules and traceable supply chains, making feedstock access and technology ownership decisive competitive drivers. Companies pursue targeted acquisitions, joint ventures and licensing plus process innovation to lock in molecules and capacity, exemplified by LanzaTech’s CirculAir partnership, recent corporate consolidation into Envalior, and startups commercializing electrochemical and direct air capture routes.
Top Player’s Company Profile
Recent Developments
SkyQuest’s ABIRAW (Advanced Business Intelligence, Research & Analysis Wing) is our Business Information Services team that Collects, Collates, Correlates, and Analyses the Data collected by means of Primary Exploratory Research backed by robust Secondary Desk research. As per SkyQuest analysis, a key driver is accelerating downstream demand from diversified end-use industries, which fuels volume and specialization needs, and a second driver is regulatory pressure for sustainability that spurs investment in bio-based routes and lower-carbon products. A restraint is feedstock price volatility that undermines investment certainty and margins. Dominating region is Asia Pacific due to integrated manufacturing ecosystems and strong downstream demand, and dominating segment is Aromatic Intermediates which underpin a wide array of downstream chemistries. Overall, the market is transitioning toward differentiated, sustainable offerings while firms balance margin pressures and supply chain resilience and pursue partnerships to scale greener routes.
| Report Metric | Details |
|---|---|
| Market size value in 2024 | USD 124.8 Billion |
| Market size value in 2033 | USD 125.3 Billion |
| Growth Rate | 5.1% |
| Base year | 2024 |
| Forecast period | (2026-2033) |
| Forecast Unit (Value) | USD Billion |
| Segments covered |
|
| Regions covered | North America (US, Canada), Europe (Germany, France, United Kingdom, Italy, Spain, Rest of Europe), Asia Pacific (China, India, Japan, Rest of Asia-Pacific), Latin America (Brazil, Rest of Latin America), Middle East & Africa (South Africa, GCC Countries, Rest of MEA) |
| Companies covered |
|
| Customization scope | Free report customization with purchase. Customization includes:-
|
To get a free trial access to our platform which is a one stop solution for all your data requirements for quicker decision making. This platform allows you to compare markets, competitors who are prominent in the market, and mega trends that are influencing the dynamics in the market. Also, get access to detailed SkyQuest exclusive matrix.
Table Of Content
Executive Summary
Market overview
Parent Market Analysis
Market overview
Market size
KEY MARKET INSIGHTS
COVID IMPACT
MARKET DYNAMICS & OUTLOOK
Market Size by Region
KEY COMPANY PROFILES
Methodology
For the Chemical Intermediates Market, our research methodology involved a mixture of primary and secondary data sources. Key steps involved in the research process are listed below:
1. Information Procurement: This stage involved the procurement of Market data or related information via primary and secondary sources. The various secondary sources used included various company websites, annual reports, trade databases, and paid databases such as Hoover's, Bloomberg Business, Factiva, and Avention. Our team did 45 primary interactions Globally which included several stakeholders such as manufacturers, customers, key opinion leaders, etc. Overall, information procurement was one of the most extensive stages in our research process.
2. Information Analysis: This step involved triangulation of data through bottom-up and top-down approaches to estimate and validate the total size and future estimate of the Chemical Intermediates Market.
3. Report Formulation: The final step entailed the placement of data points in appropriate Market spaces in an attempt to deduce viable conclusions.
4. Validation & Publishing: Validation is the most important step in the process. Validation & re-validation via an intricately designed process helped us finalize data points to be used for final calculations. The final Market estimates and forecasts were then aligned and sent to our panel of industry experts for validation of data. Once the validation was done the report was sent to our Quality Assurance team to ensure adherence to style guides, consistency & design.
Analyst Support
Customization Options
With the given market data, our dedicated team of analysts can offer you the following customization options are available for the Chemical Intermediates Market:
Product Analysis: Product matrix, which offers a detailed comparison of the product portfolio of companies.
Regional Analysis: Further analysis of the Chemical Intermediates Market for additional countries.
Competitive Analysis: Detailed analysis and profiling of additional Market players & comparative analysis of competitive products.
Go to Market Strategy: Find the high-growth channels to invest your marketing efforts and increase your customer base.
Innovation Mapping: Identify racial solutions and innovation, connected to deep ecosystems of innovators, start-ups, academics, and strategic partners.
Category Intelligence: Customized intelligence that is relevant to their supply Markets will enable them to make smarter sourcing decisions and improve their category management.
Public Company Transcript Analysis: To improve the investment performance by generating new alpha and making better-informed decisions.
Social Media Listening: To analyze the conversations and trends happening not just around your brand, but around your industry as a whole, and use those insights to make better Marketing decisions.
REQUEST FOR SAMPLE
 REQUEST FREE CUSTOMIZATION


Want to customize this report? This report can be personalized according to your needs. Our analysts and industry experts will work directly with you to understand your requirements and provide you with customized data in a short amount of time. We offer $1000 worth of FREE customization at the time of purchase.
Feedback From Our Clients


 USA (+1) 351-333-4748

