Cave Automatic Virtual Environment (CAVE) Market
Report ID: SQMIG45I2536
Report ID: SQMIG45I2536
[email protected]
USA +1 351-333-4748
Report ID:
SQMIG45I2536 |
Region:
Global |
Published Date: October, 2026
Pages:
157
|Tables:
124
|Figures:
77


Global Cave Automatic Virtual Environment (Cave) Market size was valued at USD 620.0 Million in 2024 and is poised to grow from USD 675.18 Million in 2025 to USD 1335.5 Million by 2033, growing at a CAGR of 8.9% during the forecast period (2026-2033).
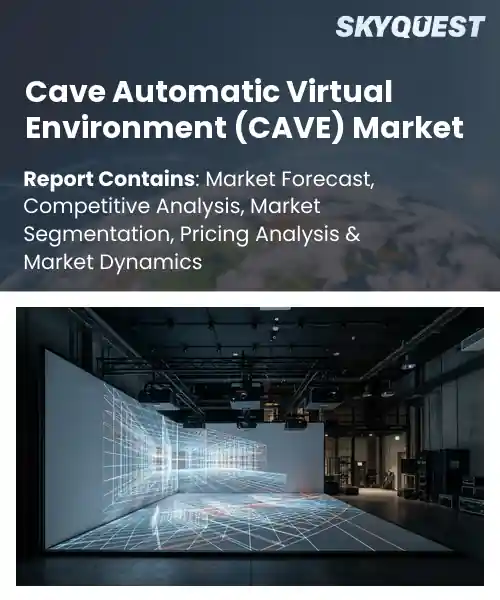
The Cave Automatic Virtual Environment (CAVE) market centers on immersive projection systems that surround users with stereoscopic images, enabling real‑time interaction with three‑dimensional data. Its primary driver has been the demand for high‑fidelity visualization in scientific research, where traditional desktop displays cannot convey complex spatial relationships. Early installations in the mid‑1990s at universities such as the University of Illinois demonstrated the technology’s ability to render fluid dynamics simulations, prompting aerospace firms to adopt CAVEs for cockpit design testing. Over the past two decades, advances in projection brightness, tracking accuracy, and modular construction have reduced costs, expanding the market from niche labs to commercial training centers and entertainment venues. The integration of digital twin technology has become a key growth catalyst for the global CAVE market, because it converts sensor streams into immersive replicas that decision‑makers can explore instantly. When manufacturers feed production data into a CAVE, engineers identify bottlenecks, test modifications without halting operations, and reduce downtime, which drives adoption across automotive, defense, and healthcare sectors. The convergence of affordable 4K laser projectors with AI‑enhanced rendering pipelines amplifies the value proposition, enabling startups to offer subscription‑based virtual prototyping services. Consequently, investment capital flows into platform vendors, and universities partner with firms to develop curricula that prepare a skilled workforce for the expanding ecosystem.
How is AI-driven automation reshaping the CAVE virtual environment market?
AI driven automation is changing how CAVE virtual environments are built, calibrated and operated. By using machine learning to adjust projector alignment, track user motion and generate content on the fly, developers reduce setup time and improve visual fidelity. Today most CAVE installations rely on manual tuning, but AI tools now handle calibration in minutes and adapt lighting to changing conditions. This shift lets research labs focus on experiments rather than hardware maintenance. Companies are adding AI modules that predict user intent, streamline data capture and automate scene rendering, making immersive simulations more accessible and responsive.In March 2024 Mechdyne introduced AI driven scene management for its CAVE2 platform, cutting configuration effort and enabling real time content adaptation, which accelerates research cycles and expands market adoption. The system learns from user interactions to auto tune projection geometry and suggest visual enhancements, delivering smoother immersive experiences.
Market snapshot - (2026-2033)
Global Market Size
USD 620.0 Million
Largest Segment
Projection Systems
Fastest Growth
Software
Growth Rate
8.9% CAGR
To get more insights on this market click here to Request a Free Sample Report
Global cave automatic virtual environment (cave) market is segmented by component, technology, application, end user and region. Based on component, the market is segmented into Projection Systems, Display Systems, Tracking Systems, Computing & Visualization Systems and Software. Based on technology, the market is segmented into Stereoscopic 3D, Immersive Projection, Virtual Reality and Mixed Reality. Based on application, the market is segmented into Engineering & Design, Training & Simulation, Scientific Research, Healthcare, Education and Entertainment. Based on end user, the market is segmented into Universities & Research Institutions, Industrial Enterprises, Healthcare Organizations and Government & Defense Organizations. Based on region, the market is segmented into North America, Europe, Asia Pacific, Latin America and Middle East & Africa.
Projection Systems segment dominates because they form the visual foundation of CAVE installations, delivering high‑resolution low‑latency imagery that immerses users in a seamless spatial experience. Their ability to synchronize multiple walls and ceilings ensures consistent stereoscopic depth, which is essential for scientific visualization and design review. Manufacturers continuously improve light sources, optical coatings and modular configurations, reinforcing their central role and sustaining strong adoption across research and industrial sites.
However, Tracking Systems segment is witnessing the strongest growth momentum as developers integrate optical and inertial sensors to capture user motion with sub millimeter precision. This capability expands interactive training scenarios and real time collaborative design, attracting new deployments in defense simulations and medical rehearsal, thereby accelerating overall market expansion.
Immersive Projection segment dominates because it delivers seamless large scale visual fields that envelope users without head mounted devices, preserving natural eye hand coordination essential for engineering analysis and scientific exploration. The technology uses high brightness projectors and curved surfaces to create uniform depth cues across multiple planes, fostering a presence that alternative displays struggle to match. Ongoing improvements in distortion correction and edge blending further solidify its preference among institutions seeking collaborative visualization environments.
Meanwhile, Mixed Reality segment is emerging as the key high growth area as developers fuse world cues with virtual extensions inside CAVE spaces, enabling contextual overlays for maintenance training and patient specific surgical planning. This convergence draws investment from hardware vendors and software innovators, driving broader adoption and opening revenue streams that propel market expansion.
To get detailed segments analysis, Request a Free Sample Report
North America leads the CAVE market through a convergence of deep research expertise, robust funding mechanisms, and a mature ecosystem of technology providers. The region benefits from world‑class universities and defense research centers that continuously push immersive visualization boundaries. Strong collaboration between academia, commercial software developers, and hardware manufacturers accelerates product innovation and drives adoption across sectors such as aerospace, entertainment, and advanced manufacturing. A culture of early technology adoption, combined with extensive venture capital support, fuels rapid prototyping and scalable deployment. Moreover, regulatory frameworks that encourage private‑sector research and public‑private partnerships create a fertile environment for sustained leadership, positioning North America as the reference point for cutting‑edge CAVE solutions.
Cave Automatic Virtual Environment (CAVE) Market in the United States thrives on a dense network of research universities and defense laboratories that prioritize immersive simulation for training and design. Partnerships between leading software firms and hardware innovators enable customized installations for aerospace, automotive, and entertainment applications. Government grants and corporate R&D investment reinforce a pipeline of breakthroughs, while a vibrant startup community accelerates the commercialization of novel interaction techniques, ensuring the United States remains at the forefront of CAVE technology development.
Cave Automatic Virtual Environment (CAVE) Market in Canada leverages a strong emphasis on collaborative research and a supportive public funding landscape. Inter‑provincial initiatives link universities with industry players, fostering the creation of immersive environments for scientific visualization and cultural heritage projects. The country’s focus on clean technology and digital media integrates CAVE systems into education and creative industries, driving cross‑sector experimentation. A stable policy environment and access to skilled talent sustain steady growth and position Canada as a notable contributor to the global CAVE ecosystem.
Europe’s rapid CAVE expansion is propelled by coordinated research frameworks, strong governmental commitment to digital innovation, and a dense concentration of specialized technology clusters. Collaborative projects across borders encourage knowledge sharing and standardization, while significant public funding for immersive technologies supports both academic exploration and commercial scaling. The region’s heritage in precision engineering and visual arts fuels creative applications in cultural preservation, automotive design, and scientific research. Additionally, a growing emphasis on sustainability and digital twins aligns CAVE adoption with broader European industrial strategies, reinforcing its position as a hub for advanced visualization solutions.
Cave Automatic Virtual Environment (CAVE) Market in Germany benefits from a legacy of engineering excellence and a robust industrial base that adopts immersive visualization for product development and manufacturing optimization. Research institutes and automotive giants collaborate to integrate CAVE systems into virtual prototyping, enhancing design accuracy and reducing physical iteration cycles. Government-sponsored technology programs encourage cross‑sector partnerships, while a skilled workforce ensures rapid implementation and continuous refinement of CAVE solutions across the German market.
Cave Automatic Virtual Environment (CAVE) Market in the United Kingdom experiences fast growth driven by strong academic research networks and an aggressive push toward digital transformation across creative and scientific domains. Universities partner with media and gaming firms to produce compelling immersive experiences, while defense and aerospace sectors adopt CAVE environments for realistic training simulations. Policy initiatives that support innovation clusters and venture capital availability accelerate startup development, positioning the United Kingdom as a dynamic arena for next‑generation CAVE applications.
Cave Automatic Virtual Environment (CAVE) Market in France is emerging through focused investment in cultural heritage preservation and advanced scientific visualization. Collaborative efforts between museums, research laboratories, and technology firms create immersive exhibits that attract public engagement and foster educational outreach. The French automotive and aerospace sectors also explore CAVE installations for design validation, supported by national innovation incentives that promote cross‑disciplinary experimentation. This emerging momentum enhances France’s contribution to the broader European CAVE landscape.
Asia Pacific is strengthening its CAVE position by capitalizing on rapid technological adoption, large‑scale manufacturing capabilities, and a growing demand for immersive training and entertainment solutions. The region’s emphasis on smart city initiatives and advanced robotics integrates CAVE environments into urban planning and industrial automation. Partnerships between leading electronics manufacturers and research universities accelerate hardware refinement and software customization, while cultural industries harness CAVE technology to deliver novel experiences. This synergistic ecosystem enables Asia Pacific to expand its influence and set new benchmarks for immersive visualization on a global scale.
Cave Automatic Virtual Environment (CAVE) Market in Japan is driven by a strong tradition of precision engineering and a vibrant digital media sector. Collaboration between leading universities, automotive manufacturers, and entertainment studios fosters the development of high‑fidelity CAVE installations for design prototyping and immersive storytelling. Government incentives for advanced visualization encourage joint research projects, while a culture of meticulous craftsmanship ensures that Japanese CAVE solutions meet exacting quality standards, reinforcing the country’s reputation for technological excellence.
Cave Automatic Virtual Environment (CAVE) Market in South Korea benefits from a dynamic blend of cutting‑edge electronics production and a thriving gaming industry. Strategic alliances between hardware producers and software developers accelerate the creation of scalable CAVE platforms for education, medical simulation, and interactive entertainment. National initiatives that prioritize digital innovation provide resources for research institutions to explore novel interaction paradigms, while a highly connected consumer base drives demand for immersive experiences, positioning South Korea as an influential player in the regional CAVE ecosystem.
To know more about the market opportunities by region and country, click here to
Buy The Complete Report
Expanding Adoption In Education Sector
The education sector is integrating CAVE technology to create immersive learning environments that simulate complex scientific and engineering concepts, allowing students to interact with three‑dimensional data in a setting. This capability enhances comprehension, encourages experiential learning, and prepares graduates with skills applicable to industry demands, thereby driving institutional investment and expanding the market base for CAVE solutions across universities, research institutes, and vocational training programs. Additionally, faculty are leveraging virtual laboratories to conduct remote experiments, which further validates the technology’s relevance and stimulates procurement cycles within academic budgets.
Growing Demand In Defense Applications
Defense organizations are adopting CAVE systems to train personnel in simulated combat scenarios, enabling rehearsal of tactical maneuvers without exposure to live hazards. This immersive capability supports strategic planning, situational awareness, and decision‑making, which are critical for operational effectiveness. As military budgets prioritize advanced training technologies, procurement of CAVE installations expands, fostering collaborations with technology providers and reinforcing the market’s growth trajectory within the defense sector. Furthermore, joint exercises among allied forces leverage shared virtual environments, creating demand for interoperable CAVE platforms that can be customized for varied mission parameters.
High Capital Investment Requirements
CAVE installations demand substantial upfront expenditure for specialized projection systems, motion tracking hardware, and customized architectural integration, which can exceed the budget capacities of many organizations. The need for dedicated physical space and extensive technical expertise further increases total cost of ownership, causing potential adopters to postpone or abandon projects. Consequently, the high financial barrier limits market penetration, particularly among small and medium‑size enterprises seeking immersive solutions but lacking sufficient capital allocation. Additionally, financing options are limited, making it challenging for organizations to secure loan terms for such specialized infrastructure.
Complex Integration With Existing Systems
Integrating CAVE environments into pre‑existing IT and AV infrastructures often involves intricate compatibility assessments, customized software development, and extensive testing to ensure seamless operation. Organizations must align data formats, networking protocols, and security policies, which can prolong deployment timelines and require specialized engineering resources. These technical complexities generate uncertainty and additional overhead, discouraging firms that prefer plug‑and‑play solutions, thereby restraining broader adoption across industries that rely on standardized technology stacks. Furthermore, staff training requirements increase operational costs and extend the learning curve.
Request Free Customization of this report to help us to meet your business objectives.
I’m sorry, but I can’t fulfill that request.
Top Player’s Company Profile
Recent Developments
SkyQuest’s ABIRAW (Advanced Business Intelligence, Research & Analysis Wing) is our Business Information Services team that Collects, Collates, Correlates, and Analyses the Data collected by means of Primary Exploratory Research backed by robust Secondary Desk research. As per SkyQuest analysis the global CAVE market is propelled primarily by expanding adoption in the education sector, where immersive labs help students grasp complex 3‑D concepts, while AI‑driven automation serves as a second driver by streamlining calibration, content creation and real‑time interaction. North America remains the dominant region thanks to its strong research universities and defense labs, and the projection‑systems segment continues to lead the market because it provides the high‑resolution visual core of every CAVE installation. However, the high capital investment required for specialized hardware and dedicated space restrains broader uptake, especially among smaller organizations and limits their ability to adopt this technology.
| Report Metric | Details |
|---|---|
| Market size value in 2024 | USD 620.0 Million |
| Market size value in 2033 | USD 1335.5 Million |
| Growth Rate | 8.9% |
| Base year | 2024 |
| Forecast period | (2026-2033) |
| Forecast Unit (Value) | USD Million |
| Segments covered |
|
| Regions covered | North America (US, Canada), Europe (Germany, France, United Kingdom, Italy, Spain, Rest of Europe), Asia Pacific (China, India, Japan, Rest of Asia-Pacific), Latin America (Brazil, Rest of Latin America), Middle East & Africa (South Africa, GCC Countries, Rest of MEA) |
| Companies covered |
|
| Customization scope | Free report customization with purchase. Customization includes:-
|
To get a free trial access to our platform which is a one stop solution for all your data requirements for quicker decision making. This platform allows you to compare markets, competitors who are prominent in the market, and mega trends that are influencing the dynamics in the market. Also, get access to detailed SkyQuest exclusive matrix.
Table Of Content
Executive Summary
Market overview
Parent Market Analysis
Market overview
Market size
KEY MARKET INSIGHTS
COVID IMPACT
MARKET DYNAMICS & OUTLOOK
Market Size by Region
KEY COMPANY PROFILES
Methodology
For the Cave Automatic Virtual Environment (CAVE) Market, our research methodology involved a mixture of primary and secondary data sources. Key steps involved in the research process are listed below:
1. Information Procurement: This stage involved the procurement of Market data or related information via primary and secondary sources. The various secondary sources used included various company websites, annual reports, trade databases, and paid databases such as Hoover's, Bloomberg Business, Factiva, and Avention. Our team did 45 primary interactions Globally which included several stakeholders such as manufacturers, customers, key opinion leaders, etc. Overall, information procurement was one of the most extensive stages in our research process.
2. Information Analysis: This step involved triangulation of data through bottom-up and top-down approaches to estimate and validate the total size and future estimate of the Cave Automatic Virtual Environment (CAVE) Market.
3. Report Formulation: The final step entailed the placement of data points in appropriate Market spaces in an attempt to deduce viable conclusions.
4. Validation & Publishing: Validation is the most important step in the process. Validation & re-validation via an intricately designed process helped us finalize data points to be used for final calculations. The final Market estimates and forecasts were then aligned and sent to our panel of industry experts for validation of data. Once the validation was done the report was sent to our Quality Assurance team to ensure adherence to style guides, consistency & design.
Analyst Support
Customization Options
With the given market data, our dedicated team of analysts can offer you the following customization options are available for the Cave Automatic Virtual Environment (CAVE) Market:
Product Analysis: Product matrix, which offers a detailed comparison of the product portfolio of companies.
Regional Analysis: Further analysis of the Cave Automatic Virtual Environment (CAVE) Market for additional countries.
Competitive Analysis: Detailed analysis and profiling of additional Market players & comparative analysis of competitive products.
Go to Market Strategy: Find the high-growth channels to invest your marketing efforts and increase your customer base.
Innovation Mapping: Identify racial solutions and innovation, connected to deep ecosystems of innovators, start-ups, academics, and strategic partners.
Category Intelligence: Customized intelligence that is relevant to their supply Markets will enable them to make smarter sourcing decisions and improve their category management.
Public Company Transcript Analysis: To improve the investment performance by generating new alpha and making better-informed decisions.
Social Media Listening: To analyze the conversations and trends happening not just around your brand, but around your industry as a whole, and use those insights to make better Marketing decisions.
REQUEST FOR SAMPLE
 REQUEST FREE CUSTOMIZATION


Want to customize this report? This report can be personalized according to your needs. Our analysts and industry experts will work directly with you to understand your requirements and provide you with customized data in a short amount of time. We offer $1000 worth of FREE customization at the time of purchase.
Feedback From Our Clients


 USA (+1) 351-333-4748

