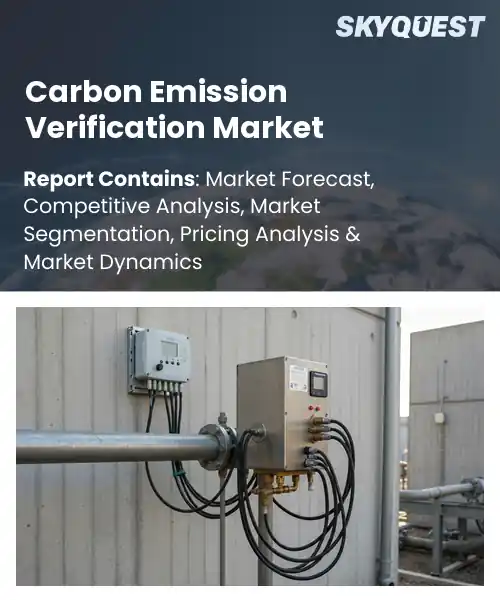
Carbon Emission Verification Market
Report ID: SQMIG20L2122
Report ID: SQMIG20L2122
[email protected]
USA +1 351-333-4748
Report ID:
SQMIG20L2122 |
Region:
Global |
Published Date: August, 2026
Pages:
157
|Tables:
124
|Figures:
77


Global Carbon Emission Verification Market size was valued at USD 2.84 Billion in 2024 and is poised to grow from USD 3.31 Billion in 2025 to USD 11.41 Billion by 2033, growing at a CAGR of 16.7% during the forecast period (2026-2033).
The carbon emission verification market trends has become a management staple, driven mainly by the need for data to support corporate net-zero pledges. This market comprises auditors, software platforms and standards bodies that evaluate, measure and verify greenhouse-gas (GHG) inventories against frameworks such as the GHG Protocol and ISO 14064. Its significance is that it can convert targets into measurable results that investors, regulators and consumers can have confidence in. The sector has grown from niche consulting projects to a multi-billion industry over the last decade, driven by the EU sustainable finance disclosure regulation and the U.S. SEC’s requirement that companies verify reported emissions.
The verification carbon emission verification market growth is driven by the need to create credits in compliance schemes which encourages providers to scale up. In addition, when companies set emission targets they buy credits to offset emissions, which creates a cycle that demands verification for larger volumes and favors companies that can provide traceability and monitoring. Microsoft’s collaboration with a verifier to certify offshore wind offsets, and BP’s use of forest-offset audits, show how verification reduces reputational risk and unlocks green-bond financing. This has led to the creation of several startups that blend satellite imagery, AI analysis and contracts to reduce verification cycles and create revenue opportunities for auditors and owners.
How are AI and Blockchain Improving Accuracy in the Carbon Emission Verification Market?
AI and blockchain are revolutionizing carbon emission verification market share, automating data collection, improving traceability, and minimizing human error. Artificial intelligence algorithms analyze sensor feeds and satellite imagery to identify sources of emissions and forecast discrepancies. Each measurement is written to the blockchain as an immutable record, creating a transparent audit trail that regulators can trust. Together these technologies enable real time verification, faster reporting cycles and lower compliance costs. Now companies are combining AI models with distributed ledgers to cross check reported values against independent data streams. This convergence builds confidence in carbon credits and helps enable broader market adoption.
IBM launched June 2023 a blockchain based platform that connects AI verified sensor data to carbon credit registries, making sure each credit is a verified emission reduction. The solution accelerates audit cycles and builds trust, leading to greater participation in voluntary carbon markets and encouraging corporate buyers to invest with confidence in the emerging green finance ecosystem.
Market snapshot - (2026-2033)
Global Market Size
USD 2.84 Billion
Largest Segment
Organizational Carbon Verification
Fastest Growth
Product Carbon Footprint Verification
Growth Rate
16.7% CAGR
To get more insights on this market click here to Request a Free Sample Report
Global carbon emission verification market is segmented by service type, verification standard, end user, verification mode and region. Based on service type, the market is segmented into organizational carbon verification, product carbon footprint verification, project emission reduction verification, carbon offset verification and ESG & sustainability assurance. Based on verification standard, the market is segmented into ISO standards, GHG protocol, voluntary carbon standards and regulatory compliance standards. Based on end user, the market is segmented into energy & utilities, manufacturing, oil & gas, transportation & logistics, construction, agriculture and commercial & other industries. Based on verification mode, the market is segmented into on-site verification, remote verification and hybrid verification. Based on region, the market is segmented into North America, Europe, Asia Pacific, Latin America and Middle East & Africa.
Organizational carbon verification segment dominates because it addresses the foundational need for companies to validate whole entity emissions, building credibility with regulators, investors, and customers. Its comprehensive scope integrates data across scopes, enabling consistent reporting and risk management. Stakeholders prioritize this assurance, driving widespread adoption and creating a stable revenue base for verification providers. It also aligns with corporate net zero roadmaps, prompting mandatory internal audits and third‑party attestations, which further cement its market leadership.
Meanwhile, product carbon footprint verification segment emerges as the most rapidly expanding area, fueled by growing consumer demand for transparent product level emissions data. Manufacturers are integrating life cycle assessments into branding, prompting verification firms to develop specialized tools and agile methodologies. This surge unlocks new service lines and deepens market penetration across retail and supply chain ecosystems.
Onsite verification segment dominates because it offers tactile inspection, physical sampling, and direct stakeholder engagement that reinforce data integrity. Clients value the tangible evidence gathered during field visits, which reduces skepticism and satisfies stringent audit requirements. The hands on approach also facilitates immediate corrective actions, building trust and cementing long term relationships with verification providers. Additionally, many high risk industries consider physical presence essential for verifying complex process emissions, reinforcing its preferential status among regulators and investors.
Conversely, hybrid verification segment is witnessing the strongest growth momentum, blending onsite rigor with digital data analytics to enhance efficiency. Organizations seek cost effective solutions that retain assurance while leveraging remote sensors and AI driven audits. This integrated model expands service capacity, attracts tech savvy clients, and accelerates market scalability across diverse industries.
To get detailed segments analysis, Request a Free Sample Report
Europe’s lead is the result of a combination of rigorous regulations, existing sustainability commitments and a developed ecosystem of verification service providers. The region is characterized by harmonized standards that promote consistent cross-border reporting and motivate organizations to seek independent verification to comply and satisfy stakeholder expectations. Close collaboration between governments, industry bodies and research institutions acts as a catalyst for innovation in verification methodologies. The introduction of digital instruments further enhances transparency and efficiency. Furthermore, a culture of environmental responsibility and proactive climate policies fosters a market environment where verification is not just a compliance exercise but a strategic advantage, solidifying Europe's leadership in the global carbon verification space.
Carbon emission verification market outlook in Germany is propelled by a robust legal framework that mandates detailed emissions reporting for a wide range of sectors. The presence of leading verification firms and a strong engineering base supports sophisticated verification processes. Companies increasingly view verification as a pathway to enhance credibility with investors and supply‑chain partners, while academic institutions contribute cutting‑edge research that refines verification techniques. This synergy of regulation, expertise, and innovation sustains Germany’s pivotal role in the European verification landscape.
Carbon emission verification market forecast in the United Kingdom benefits from a proactive policy environment that encourages transparent emissions accounting across industries. The market is characterized by a high concentration of specialist verification providers that leverage advanced analytics and digital platforms. Corporate governance standards place verification at the core of sustainability reporting, prompting firms to adopt rigorous verification practices. Collaborative initiatives between regulators, industry groups, and research centers further enhance methodological robustness, positioning the United Kingdom as a key hub for verification excellence within Europe.
Carbon emission verification market regional outlook in France is driven by comprehensive climate legislation that requires detailed emissions disclosure for both public and private entities. A network of experienced verification firms, supported by strong technical expertise, delivers high‑quality assurance services. French corporations view verification as essential for meeting investor expectations and for aligning with national climate objectives. Ongoing dialogue between policymakers, industry associations, and academic researchers fosters continuous improvement of verification standards, reinforcing France’s influential role in shaping the European verification ecosystem.
In North America, the rapid growth is fueled by growing corporate responsibility, changing regulatory expectations, and a heightened focus on climate-related risk management. Verification is becoming a part of companies’ sustainability strategies to meet investors’ need for reliable emissions data and to stand out in competitive markets. Sophisticated verification technologies such as blockchain and AI-driven analytics are making the verification processes more reliable and faster. In addition, cooperation between industry groups, standards organizations and government agencies promote the adoption of consistent verification practices, creating a fertile environment for market growth across the continent.
Carbon emission verification market regional forecast in the United States is shaped by a dynamic regulatory landscape that encourages transparent emissions reporting across diverse sectors. Leading verification firms leverage advanced data analytics and digital platforms to deliver precise assurance services. Corporate investors place strong emphasis on verified emissions data, prompting firms to adopt rigorous verification as a cornerstone of ESG reporting. Partnerships between academia, industry, and standards organizations drive methodological innovation, reinforcing the United States as a pivotal market for verification services.
Carbon emission verification market analysis in Canada benefits from progressive climate policies that incentivize accurate emissions accounting for both large enterprises and emerging industries. A network of specialized verification providers offers tailored services that align with national sustainability goals. Canadian firms increasingly recognize verification as essential for accessing green financing and for meeting stakeholder expectations. Collaborative research initiatives between universities and industry enhance verification methodologies, supporting Canada’s expanding role in the North American verification ecosystem.
In Asia Pacific, strategic investments in verification capabilities, aligning with emerging carbon pricing mechanisms and a surge in corporate sustainability commitments are bolstering the region’s position. Countries in the region are adopting harmonized reporting standards which enable cross-border verification. Technology adoption accelerates efficiency of verification processes. Market needs-specific localized verification frameworks are being developed through industry consortia and government agencies. This collective action, combined with growing investor scrutiny of credible emissions data, is raising the region’s profile and broadening the range of verification services across the Asia Pacific landscape.
Carbon emission verification market penetration in Japan is propelled by stringent environmental regulations that require detailed emissions disclosure for a broad spectrum of industries. Leading verification firms integrate cutting‑edge digital tools to enhance data accuracy and audit efficiency. Japanese corporations view verification as integral to their global sustainability narratives, seeking assurance to meet both domestic and international stakeholder expectations. Ongoing collaboration between regulatory bodies, industry associations, and research institutions drives continuous improvement of verification standards, reinforcing Japan’s prominent role in the regional verification arena.
Carbon emission verification industry in South Korea is driven by robust climate policies that mandate comprehensive emissions reporting for key sectors. A growing pool of verification experts employs sophisticated analytics and automation to deliver high‑quality assurance. Companies leverage verification to strengthen credibility with investors and to align with national carbon reduction targets. Partnerships among government agencies, industry groups, and academic researchers foster the development of innovative verification methodologies, positioning South Korea as an emerging leader in the Asia Pacific verification landscape.
To know more about the market opportunities by region and country, click here to
Buy The Complete Report
Regulatory Pressure is Increasing
Corporate Sustainability Goals are Expanding
High Verification Cost is Deterring
Lack of Standardized Methodologies is Hindering
Request Free Customization of this report to help us to meet your business objectives.
The global carbon emission verification market is characterized by strong competition among established testing, inspection, certification, and sustainability-services providers, with companies increasingly differentiating themselves through digital verification, emissions-data analytics, remote auditing, and carbon-accounting capabilities. Leading players such as SGS, Bureau Veritas, DNV, TÜV SÜD, Intertek, LRQA, and ERM are expanding their carbon-verification portfolios to address growing demand for independently assured emissions data, carbon-credit validation, and regulatory reporting. Competition is also intensifying as digital-native companies such as Sylvera and CarbonChain use satellite data, artificial intelligence, automated carbon accounting, and supply-chain data to improve transparency and traceability.
Top Player’s Company Profile
Recent Developments in the Carbon Emission Verification Market
SkyQuest’s ABIRAW (Advanced Business Intelligence, Research & Analysis Wing) is our Business Information Services team that Collects, Collates, Correlates, and Analyses the Data collected by means of Primary Exploratory Research backed by robust Secondary Desk research. As per SkyQuest analysis, the global carbon emission verification market is being propelled primarily by tightening regulatory pressure that forces companies to obtain third‑party assurance for emissions data, while expanding corporate sustainability goals provide a second powerful catalyst as firms seek credible validation for net‑zero pledges. The organizational carbon verification segment leads the market, reflecting the widespread need to certify whole‑entity footprints, and Europe emerges as the dominant region thanks to its rigorous climate legislation and mature verification ecosystem. However, the high cost of comprehensive verification services remains a notable restraint, especially for smaller players, tempering broader adoption despite the strong demand drivers.
| Report Metric | Details |
|---|---|
| Market size value in 2024 | USD 2.84 Billion |
| Market size value in 2033 | USD 11.41 Billion |
| Growth Rate | 16.7% |
| Base year | 2024 |
| Forecast period | (2026-2033) |
| Forecast Unit (Value) | USD Billion |
| Segments covered |
|
| Regions covered | North America (US, Canada), Europe (Germany, France, United Kingdom, Italy, Spain, Rest of Europe), Asia Pacific (China, India, Japan, Rest of Asia-Pacific), Latin America (Brazil, Rest of Latin America), Middle East & Africa (South Africa, GCC Countries, Rest of MEA) |
| Companies covered |
|
| Customization scope | Free report customization with purchase. Customization includes:-
|
To get a free trial access to our platform which is a one stop solution for all your data requirements for quicker decision making. This platform allows you to compare markets, competitors who are prominent in the market, and mega trends that are influencing the dynamics in the market. Also, get access to detailed SkyQuest exclusive matrix.
Table Of Content
Executive Summary
Market overview
Parent Market Analysis
Market overview
Market size
KEY MARKET INSIGHTS
COVID IMPACT
MARKET DYNAMICS & OUTLOOK
Market Size by Region
KEY COMPANY PROFILES
Methodology
For the Carbon Emission Verification Market, our research methodology involved a mixture of primary and secondary data sources. Key steps involved in the research process are listed below:
1. Information Procurement: This stage involved the procurement of Market data or related information via primary and secondary sources. The various secondary sources used included various company websites, annual reports, trade databases, and paid databases such as Hoover's, Bloomberg Business, Factiva, and Avention. Our team did 45 primary interactions Globally which included several stakeholders such as manufacturers, customers, key opinion leaders, etc. Overall, information procurement was one of the most extensive stages in our research process.
2. Information Analysis: This step involved triangulation of data through bottom-up and top-down approaches to estimate and validate the total size and future estimate of the Carbon Emission Verification Market.
3. Report Formulation: The final step entailed the placement of data points in appropriate Market spaces in an attempt to deduce viable conclusions.
4. Validation & Publishing: Validation is the most important step in the process. Validation & re-validation via an intricately designed process helped us finalize data points to be used for final calculations. The final Market estimates and forecasts were then aligned and sent to our panel of industry experts for validation of data. Once the validation was done the report was sent to our Quality Assurance team to ensure adherence to style guides, consistency & design.
Analyst Support
Customization Options
With the given market data, our dedicated team of analysts can offer you the following customization options are available for the Carbon Emission Verification Market:
Product Analysis: Product matrix, which offers a detailed comparison of the product portfolio of companies.
Regional Analysis: Further analysis of the Carbon Emission Verification Market for additional countries.
Competitive Analysis: Detailed analysis and profiling of additional Market players & comparative analysis of competitive products.
Go to Market Strategy: Find the high-growth channels to invest your marketing efforts and increase your customer base.
Innovation Mapping: Identify racial solutions and innovation, connected to deep ecosystems of innovators, start-ups, academics, and strategic partners.
Category Intelligence: Customized intelligence that is relevant to their supply Markets will enable them to make smarter sourcing decisions and improve their category management.
Public Company Transcript Analysis: To improve the investment performance by generating new alpha and making better-informed decisions.
Social Media Listening: To analyze the conversations and trends happening not just around your brand, but around your industry as a whole, and use those insights to make better Marketing decisions.
REQUEST FOR SAMPLE
 REQUEST FREE CUSTOMIZATION
Global Carbon Emission Verification Market size was valued at USD 2.84 Billion in 2024 and is poised to grow from USD 3.31 Billion in 2025 to USD 11.41 Billion by 2033, growing at a CAGR of 16.7% during the forecast period (2026-2033).
The carbon emission verification market is shaped by intense rivalry as firms vie for credibility and data access, driving alliances and technology upgrades. Major players accelerate M&A, exemplified by Verra’s acquisition of a blockchain startup, while South Pole’s partnership with Microsoft embeds verification data into cloud services. IBM’s blockchain pilot with Verra showcases tech innovation to streamline third‑party validation. 'SGS SA', 'Bureau Veritas SA', 'TÜV SÜD AG', 'DEKRA SE', 'DNV AS', 'Intertek Group plc', 'Eurofins Scientific SE', 'ERM Group Limited', 'SCS Global Services', 'LRQA Group Limited', 'Control Union Group B.V.', 'Applus+ Services, S.A.', 'UL Solutions Inc.', 'Kiwa N.V.', 'TÜV Rheinland AG', 'RINA S.p.A.', 'BSI Group', 'ERM Certification and Verification Services Limited', 'Carbon Check (India) Private Limited', 'Earthood Services Private Limited'
The intensifying global regulatory environment compels corporations to adopt verified carbon accounting, prompting demand for independent verification services. As governments embed stricter emissions reporting requirements into legislation, organizations seek credible third‑party validation to demonstrate compliance and avoid penalties. This regulatory momentum not only creates a recurring need for verification expertise but also enhances market credibility, encouraging broader participation across sectors. Consequently, verification providers experience sustained growth opportunities driven by the necessity to meet evolving statutory obligations through ongoing monitoring processes to ensure long‑term alignment.
Regulatory Assurance Drives Demand: Companies are increasingly seeking third‑party verification to demonstrate compliance with emerging carbon‑reporting regulations, such as the European Green Deal and U.S. SEC climate disclosures. This regulatory pressure creates a steady pipeline of verification projects across manufacturing, energy, and transportation sectors. By obtaining credible third‑party certificates, firms can mitigate legal risk, unlock green financing, and enhance stakeholder trust. Consequently, verification service providers are expanding dedicated teams and adopting integrated digital platforms to meet the growing compliance‑driven demand for their sustainability objectives.
Why does Europe Dominate the Global Carbon Emission Verification Market? |@12


Want to customize this report? This report can be personalized according to your needs. Our analysts and industry experts will work directly with you to understand your requirements and provide you with customized data in a short amount of time. We offer $1000 worth of FREE customization at the time of purchase.
Feedback From Our Clients


 USA (+1) 351-333-4748

