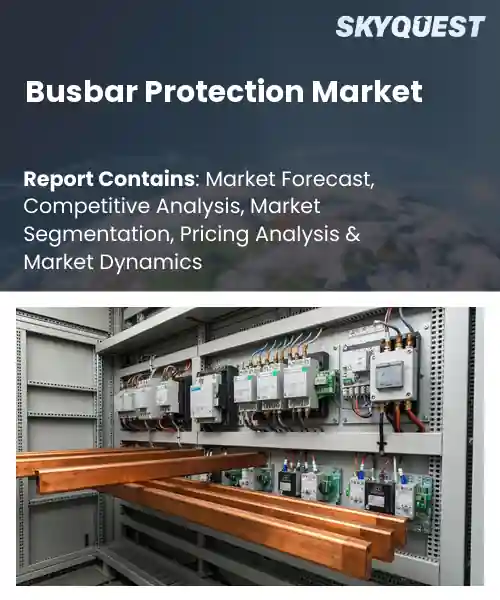
Busbar Protection Market
Report ID: SQMIG20D2565
Report ID: SQMIG20D2565
[email protected]
USA +1 351-333-4748
Report ID:
SQMIG20D2565 |
Region:
Global |
Published Date: March, 2026
Pages:
157
|Tables:
203
|Figures:
80


Global Busbar Protection Market size was valued at USD 4.5 Billion in 2024 and is poised to grow from USD 4.79 Billion in 2025 to USD 7.86 Billion by 2033, growing at a CAGR of 6.4% during the forecast period (2026-2033).
Busbar protection market is driven primarily by the need to safeguard critical substation infrastructure as power systems grow more complex. Busbar protection is the relaying and scheme used for the detection of faults on the busbar conductors to isolate the fault and protect associated equipment from damage as well as prevent a cascading outage. This is a significant problem for the utility and industrial customers due to that fact that the failure of a busbar can lead to large-scale blackouts and costly downtime. Historically the sector migrated from electromechanical relays to numerical protective relays with IEC 61850 communications, for example, in modern HV and EHV substations worldwide, supporting grid modernization goals.
Building on modernization of substations, a key trend driving the global busbar protection sector is the integration of digital communications and adaptive protection algorithms, because variable power flows from renewables and distributed resources undermine static protection settings. As a result vendors offering numerical relays with IEC 61850, synchrophasor inputs, and software-based adaptive schemes see increased demand for upgrades and retrofits in utility and industrial sites. For example, operators integrating large solar farms require faster fault discrimination to avoid unnecessary islanding, which drives procurement of microprocessor-based busbar protection. This cause-and-effect dynamic creates opportunities for services, firmware upgrades, and cybersecurity solutions tied to protection deployments globally annually.
How is AI Improving Fault Detection Accuracy in the Busbar Protection Market?
Busbar protection focuses on detecting faults inside a bus zone by comparing current and voltage signatures across connected bays. AI improves accuracy by learning normal operating patterns and flagging subtle deviations that traditional threshold logic misses. Today's machine learning algorithms allow for the merging of data generated by different types of sensors, communication protocols, and digital relays to help differentiate between internal faults, external disturbances, and inrush currents. This reduces nuisance tripping and speeds correct isolation while adapting protection settings as load and renewable generation patterns change. The market is shifting toward digital substations and adaptive protection because utilities need more reliable fault discrimination under dynamic grid conditions.
In February 2026, GE Vernova introduced a software defined automation and protection platform that consolidates multiple protection functions and enables analytics and machine learning to run centrally or at the edge. The Fault Detection Procedure has improved and simplified lifecycle updates resulting in increased efficiency and time for deployment in the busbar protection marketplace.
Market snapshot - (2026-2033)
Global Market Size
USD 4.5 Billion
Largest Segment
Differential Protection
Fastest Growth
Arc Flash Protection
Growth Rate
6.4% CAGR
To get more insights on this market click here to Request a Free Sample Report
Global busbar protection market is segmented by protection type, installation type, busbar configuration, voltage, impedance, application, end user and region. Based on protection type, the market is segmented into overcurrent protection, earth fault protection, differential protection and arc flash protection. Based on installation type, the market is segmented into indoor busbars and outdoor busbars. Based on busbar configuration, the market is segmented into single busbar, double busbar and main-tie-main busbar. Based on voltage, the market is segmented into low voltage, medium voltage, high voltage and extra-high voltage. Based on impedance, the market is segmented into low impedance and high impedance. Based on application, the market is segmented into substations, power plants, industrial facilities, data centers, railway electrification, marine and offshore and others. Based on end user, the market is segmented into utilities, industries, transportation and commercial buildings. Based on region, the market is segmented into North America, Europe, Asia Pacific, Latin America and Middle East & Africa.
Based on the global busbar protection market growth, differential protection segment dominates because differential schemes offer the most precise and selective detection of internal busbar faults, enabling near-instant isolation of affected zones and limiting collateral damage. High sensitivity and fault classification result in simpler relay coordination, a reduced duration of outages and provide protection for interconnecting equipment, therefore promoting widespread use of such devices for critical electricity networks. Digital relay integration/standardized communication systems also enhances elections by making maintenance easier and improving fault detection for asset owners.
However, overcurrent protection is witnessing the strongest growth momentum as simplified electronic overcurrent relays become more capable and cost-effective for general-purpose busbar protection. Retrofit solutions are rapidly being adopted due to a considerable increase in demand for them, their broad range of available installation applications, and the relative ease with which they may be integrated into existing protection schemes.
Data centers segment dominates because operators demand continuous availability and strict power quality, making advanced busbar protection a procurement priority. Systems that provide rapid fault clearing, arc flash prevention and integration with building management systems and power management systems support service level agreements and compact, modular power architectures. Because of this focus on reliability, manufacturers are making significant investments in advanced protection capabilities which minimize the risk of downtime due to equipment failure and enhance predictive maintenance strategies.
On the other hand, railway electrification is emerging as the key high-growth area as expanding electrified networks require robust, fault-tolerant busbar protection tailored to high-power traction systems. The demand for ruggedized, coordinated defense products is being driven by strict safety standards, specialized environmental requirements, and an increase in traction power installations. This demand will lead to greater customization of solutions and service offerings from the aftermarket, as well as an expanded marketplace that can utilize cross-industry technologies.
To get detailed segments analysis, Request a Free Sample Report
As per the global busbar protection market share, rapid expansion in Asia Pacific is driven by a combination of extensive network development, proactive modernization of transmission and distribution assets, and a strong industrial base demanding high reliability. The increased electrification from urbanization highlights the need for effective protection systems. To meet the challenge of integrating distributed generation and renewables into the electric grid, systems must be adaptive and communication-enabled. The regional workforce has a concentration of manufacturers and engineers, utilities working closely with technology providers, and active R&D efforts to develop new functions and diagnostic capabilities for digital relays to advance grid resilience and safety, as well as support competitive suppliers providing products for both domestic and export markets.
Busbar protection market in Japan benefits from early adoption of sophisticated protection technologies driven by a relentless focus on grid reliability and industrial continuity. Utilities and large industrial consumers prioritize high integrity protection systems, encouraging vendors to refine algorithmic detection and digital communication capabilities. Strong domestic engineering expertise, ties between manufacturers and research institutions, and system testing create an environment where advanced busbar protection solutions are now developed and implemented.
Busbar protection market in South Korea reflects rapid technological adoption and close collaboration among utilities, vendors and research centers. The increased stress placed upon digitalization and interoperability is encouraging the growth in use of adaptive protection schemes by both industrial and urban jurisdictions with complex networks. Domestic engineering companies have developed compact relay systems or "relays in a box" and provided software enabled diagnostics. In addition, the competitive supplier environment and working with grid operators allows for the successful and integrated implementation of robust busbar protection solutions on both transmission and distribution networks.
Based on global busbar protection market regional forecast, rapid expansion in Europe stems from policy driven reliability requirements, concerted investment in grid reinforcements, and the imperative to replace aging assets while integrating distributed energy resources. To reduce outages, transmission and distribution operators focus primarily on using advanced protection solutions as part of facilitating cross border interconnections. To speed up the adoption of digital relays and add enhanced diagnostics and cybersecurity functionality, there is currently a mature engineering model and a range of vendors in the digital relay market. Collaborative pilot projects, standardization efforts and close engagement between technology suppliers and network operators further stimulate deployment across heterogeneous network configurations and industrial applications.
Busbar protection market in Germany is anchored by a mature power sector with a strong focus on reliability. Domestic manufacturing strength and protection engineering expertise drive demand for relay functions and integrated communication protocols. Network operators prioritize lifecycle management and coordinated protection studies, prompting suppliers to deliver interoperable, proven solutions. Collaboration among utilities, equipment manufacturers and specialist integrators accelerates deployment of tailored busbar protection systems across industrial and grid environments.
Busbar protection market in United Kingdom is experiencing growth driven by modernization of aged networks and integration of distributed generation, including offshore assets. Utilities and developers prioritize flexible, communication enabled protection that supports complex coordination and islanding. The fast delivery of a high-performance service ecosystem supports modular and software based solutions. Regulation's focus on both resilience and collaboration through pilot projects with system operators and vendors drives forward adoption of new technologies in the transmission and distribution sectors.
Busbar protection market in France is emerging as utilities pursue upgrades and integration of variable generation into complex network topologies. By focusing attention to aligning protection strategies across multiple asset classes (including legacy), will present opportunities for modular and/or software based solutions. Local manufacturers and engineering consultancies will work together with transmission operators on deployment situations while regulatory requirements for system reliability and safety will create a push towards installing adaptive protection schemes as well as improved monitoring technologies and innovative solutions.
As per global busbar protection market regional outlook, North America is strengthening its position through coordinated modernization of transmission and distribution infrastructure, a heightened focus on resilience and the growing prevalence of microgrids and distributed resources. Utilities and independent system operators seek protection solutions that combine precise fault detection with digital communication, interoperability and enhanced cybersecurity. A robust vendor base, active technical research and dedicated test facilities support iterative development and field validation. Policy emphasis on infrastructure reliability, together with collaborative pilots and close cooperation among utilities, manufacturers and engineering firms, is driving broader adoption of advanced busbar protection across diverse industrial and grid contexts.
Busbar protection market in United States is driven by modernization of infrastructure and emphasis on resilience against physical and cyber disruptions. Industrial operators and utilities need scalable, communication enabled protection integrated into automation platforms. Accelerating prototypes and field tests is supported by strong supplier networks and research. There is an emphasis on coordinated protection strategies across transmission, industrial and distribution environments (supporting wider deployment) which allows for significant measurement of operational benefits.
Busbar protection market in Canada reflects focus on resilience in remote networks and integration of distributed resources across varied climates. Many utilities pilot digital protection programs in conjunction with domestic manufacturers, technology vendors and provincial utilities as well as test for compatibility between different systems. By focusing on lifecycle management, ease of use in the field and customized solutions, utilities can promote the use of these technologies within transmission, distribution and industrial settings at the regional level as well.
To know more about the market opportunities by region and country, click here to
Buy The Complete Report
Increasing Demand For Grid Reliability
The busbar protection system improves reliability of operations by quickly and selectively isolating faults on busbars, thereby limiting the outage areas and providing power continuity. This helps grid operators and utilities feel confident about containing disturbances in the electrical system, which influences their decision-making to deploy modern substations and distribution centers. Since utilities are focused on providing uninterrupted service and ensuring resiliency, the role of busbar protection in securing critical nodes and enabling coordinated protection schemes is driving utilities' procurement and modernization initiatives throughout their transmission and distribution networks.
Integration With Smart Grid Technologies
Smart grid technologies and busbar protection subscriptions are keys to a sophisticated integrated monitoring and remote diagnostic adaptive protection scheme in sync with real-time system conditions. Utility companies can use devices that communicate with each other, along with standardized protocols, to improve their situational awareness at the critical nodes of their systems and coordinate the protection response across multiple assets. The convergence of these functions creates a number of operational risk considerations, simplifies the management of assets, and encourages investments in integrated protection solutions. Busbar protection's ability to interface with intelligent grid platforms supports digitalization efforts being considered by network operators and the overall adoption of these technologies in the future.
High Initial Capital Requirement
Utilities and operators are often deterred from adopting advanced busbar protection solutions because of the large initial capital investment that is typically required to implement them. High costs for new communication interfaces, engineering integration and/or commissioning of specialized protection relays create a high barrier to march as retrofitting to current substations and deploying at smaller sites. Decision makers have difficulty prioritizing what to spend their limited budgets on; they may choose to defer investments that have significant upfront costs in favour of alternative lower cost or phased approaches. This can create longer procurement cycles, which limits the market's ability to grow in the short term.
Complexity Of Integration With Legacy Systems
Installing new modern busbar protection equipment into existing legacy electrical installations involves multiple technical issues and could limit the ability to adopt them because they must be compatibly engineered and validated with so many types of existing equipment, protection schemes and communication standards. Existing wiring may require adjustments to accommodate the new busbar protective relaying, coordination may be required to set the protective settings of various different devices and extensive testing may take longer than anticipated, thus increasing project timelines and resource needs. Utilities may avoid disruptive upgrades that risk operational stability or require specialized skills, preferring incremental changes instead, which constrains large-scale rollouts and reduces the speed at which newer protection technologies penetrate established systems.
Request Free Customization of this report to help us to meet your business objectives.
The competitive landscape in the global busbar protection market outlook is centred on established OEMs and rapid consolidation, with M&A and large framework awards reshaping supplier positions. Pure play busbar protection startups remain scarce, pushing vendors to compete through protocol level innovation, product releases and utility partnerships. Examples include Hitachi completing the ABB Power Grids acquisition, major TSO multi supplier framework awards, and recent distributed busbar product releases from major vendors.
SkyQuest’s ABIRAW (Advanced Business Intelligence, Research & Analysis Wing) is our Business Information Services team that Collects, Collates, Correlates, and Analyses the Data collected by means of Primary Exploratory Research backed by robust Secondary Desk research.
As per SkyQuest analysis, the global busbar protection industry is driven primarily by the imperative to safeguard critical substation infrastructure and enhance grid reliability, while integration of digital communications and adaptive protection algorithms further accelerates demand for numerical relays and smart diagnostic solutions. Advanced protection systems can hinder faster adoption by having high initial capital investments, especially for existing networks. The Asia-Pacific region has the largest market share due to the rapid expansion of new networks and the integration of renewable generation. The differential protection type of advanced protection system is the predominant type of advanced protection system due to the extremely high sensitivity and the ability to provide selective fault isolation.
| Report Metric | Details |
|---|---|
| Market size value in 2024 | USD 4.5 Billion |
| Market size value in 2033 | USD 7.86 Billion |
| Growth Rate | 6.4% |
| Base year | 2024 |
| Forecast period | (2026-2033) |
| Forecast Unit (Value) | USD Billion |
| Segments covered |
|
| Regions covered | North America (US, Canada), Europe (Germany, France, United Kingdom, Italy, Spain, Rest of Europe), Asia Pacific (China, India, Japan, Rest of Asia-Pacific), Latin America (Brazil, Rest of Latin America), Middle East & Africa (South Africa, GCC Countries, Rest of MEA) |
| Companies covered |
|
| Customization scope | Free report customization with purchase. Customization includes:-
|
To get a free trial access to our platform which is a one stop solution for all your data requirements for quicker decision making. This platform allows you to compare markets, competitors who are prominent in the market, and mega trends that are influencing the dynamics in the market. Also, get access to detailed SkyQuest exclusive matrix.
Table Of Content
Executive Summary
Market overview
Parent Market Analysis
Market overview
Market size
KEY MARKET INSIGHTS
COVID IMPACT
MARKET DYNAMICS & OUTLOOK
Market Size by Region
KEY COMPANY PROFILES
Methodology
For the Busbar Protection Market, our research methodology involved a mixture of primary and secondary data sources. Key steps involved in the research process are listed below:
1. Information Procurement: This stage involved the procurement of Market data or related information via primary and secondary sources. The various secondary sources used included various company websites, annual reports, trade databases, and paid databases such as Hoover's, Bloomberg Business, Factiva, and Avention. Our team did 45 primary interactions Globally which included several stakeholders such as manufacturers, customers, key opinion leaders, etc. Overall, information procurement was one of the most extensive stages in our research process.
2. Information Analysis: This step involved triangulation of data through bottom-up and top-down approaches to estimate and validate the total size and future estimate of the Busbar Protection Market.
3. Report Formulation: The final step entailed the placement of data points in appropriate Market spaces in an attempt to deduce viable conclusions.
4. Validation & Publishing: Validation is the most important step in the process. Validation & re-validation via an intricately designed process helped us finalize data points to be used for final calculations. The final Market estimates and forecasts were then aligned and sent to our panel of industry experts for validation of data. Once the validation was done the report was sent to our Quality Assurance team to ensure adherence to style guides, consistency & design.
Analyst Support
Customization Options
With the given market data, our dedicated team of analysts can offer you the following customization options are available for the Busbar Protection Market:
Product Analysis: Product matrix, which offers a detailed comparison of the product portfolio of companies.
Regional Analysis: Further analysis of the Busbar Protection Market for additional countries.
Competitive Analysis: Detailed analysis and profiling of additional Market players & comparative analysis of competitive products.
Go to Market Strategy: Find the high-growth channels to invest your marketing efforts and increase your customer base.
Innovation Mapping: Identify racial solutions and innovation, connected to deep ecosystems of innovators, start-ups, academics, and strategic partners.
Category Intelligence: Customized intelligence that is relevant to their supply Markets will enable them to make smarter sourcing decisions and improve their category management.
Public Company Transcript Analysis: To improve the investment performance by generating new alpha and making better-informed decisions.
Social Media Listening: To analyze the conversations and trends happening not just around your brand, but around your industry as a whole, and use those insights to make better Marketing decisions.
REQUEST FOR SAMPLE
 REQUEST FREE CUSTOMIZATION
Global Busbar Protection Market size was valued at USD 4.5 Billion in 2024 and is poised to grow from USD 4.79 Billion in 2025 to USD 7.86 Billion by 2033, growing at a CAGR of 6.4% during the forecast period (2026-2033).
The competitive landscape is centred on established OEMs and rapid consolidation, with M&A and large framework awards reshaping supplier positions. Pure play busbar protection startups remain scarce, pushing vendors to compete through protocol level innovation, product releases and utility partnerships. Examples include Hitachi completing the ABB Power Grids acquisition, major TSO multi supplier framework awards, and recent distributed busbar product releases from major vendors. 'ABB', 'Eaton Corporation', 'Schneider Electric SE', 'Siemens', 'General Electric Company', 'Mitsubishi Electric Corporation', 'NR Electric Co.', 'Basler Electric', 'Hitachi Energy Ltd', 'Littelfuse Inc.', 'Andritz AG', 'Crompton Greaves', 'Toshiba', 'Rockwell Automation', 'Hyundai Electric', 'Arcteq Relays Ltd.', 'ERL Phase Power Technologies', 'NARI Group', 'Megger Group', 'ZIV'
Busbar protection systems enhance operational reliability by enabling rapid and selective isolation of faults on busbars, thereby minimizing the scope of outages and preserving power continuity. This capability reassures grid operators and utilities that system disturbances can be contained, supporting deployment decisions for modern substations and distribution centers. As utilities prioritize uninterrupted service and resilience, the inherent role of busbar protection in protecting critical nodes and facilitating coordinated protection schemes drives procurement and modernization initiatives across transmission and distribution networks.
Decentralized Energy Integration: Deployment of distributed generation and microgrids is reshaping protection requirements, prompting adoption of busbar protection solutions that manage bidirectional flows and variable fault characteristics. Vendors are adapting designs for modular interoperable systems compatible with inverter-rich environments and battery storage. Emphasis on scalability and standardized interfaces enables smoother integration with local control schemes and coordination. Utilities and industrial operators increasingly prioritize resilience and adaptive protection, driving demand for systems that support flexible topology changes and rapid restoration after severe grid disturbances.
As per the global busbar protection market share, rapid expansion in Asia Pacific is driven by a combination of extensive network development, proactive modernization of transmission and distribution assets, and a strong industrial base demanding high reliability.


Want to customize this report? This report can be personalized according to your needs. Our analysts and industry experts will work directly with you to understand your requirements and provide you with customized data in a short amount of time. We offer $1000 worth of FREE customization at the time of purchase.
Feedback From Our Clients


 USA (+1) 351-333-4748

