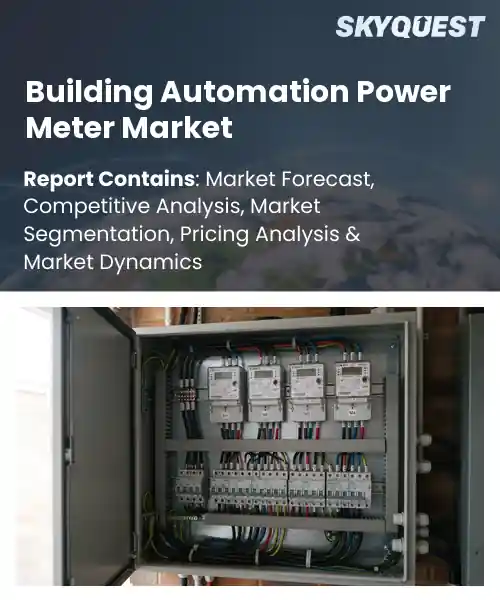
Building Automation Power Meter Market
Report ID: SQMIG45J2827
Report ID: SQMIG45J2827
[email protected]
USA +1 351-333-4748
Report ID:
SQMIG45J2827 |
Region:
Global |
Published Date: August, 2026
Pages:
157
|Tables:
146
|Figures:
78


Global Building Automation Power Meter Market size was valued at USD 9.42 Billion in 2024 and is poised to grow from USD 10.21 Billion in 2025 to USD 19.47 Billion by 2033, growing at a CAGR of 8.4% during the forecast period (2026-2033).
The global building automation power meter market comprises devices that monitor electrical consumption in smart‑controlled facilities, enabling real‑time data collection, load profiling, and demand‑response actions. Its importance stems from rising energy costs, stricter emissions regulations, and the shift toward integrated digital twins that require precise consumption metrics. Historically, the sector evolved from standalone analog wattmeters in the 1990s to networked, IoT‑enabled meters that communicate via BACnet or Modbus, illustrated by Schneider Electric’s EcoStruxure line deployed across European campuses. This technological progression has amplified data granularity, simplified retrofits, and attracted investors seeking to capitalize on energy‑efficiency incentives worldwide for stakeholders globally. Regulatory pressure on carbon footprints acts as the chief catalyst expanding the global building automation power meter market, because mandated reporting forces owners to adopt precise meters. Government‑imposed building‑code thresholds compel facilities to install meters for compliance, prompting vendors to add analytics that turn raw kWh data into savings. The City of Los Angeles’ Smart Grid Initiative linked power meters to a central dashboard, cutting municipal electricity use by 12 % in two years and showing cost avoidance. This success spurs demand across commercial real‑estate portfolios, creating opportunities for cloud‑based services, retrofit kits, and predictive maintenance models that monetize data streams.
How is AI-driven analytics reshaping the building automation power meter market?
AI-driven analytics are turning raw power‑meter data into actionable insights that optimize energy use and reduce operational costs. By continuously learning patterns of consumption, these systems can predict peak loads, detect anomalies, and recommend adjustments in real time. Integration with building management platforms enables seamless coordination between HVAC, lighting, and security, creating a holistic view of building performance. The technology also supports predictive maintenance, alerting facilities teams before equipment fails, which minimizes downtime. As occupants demand greener and smarter environments, AI‑enhanced meters are becoming essential for meeting sustainability goals while maintaining comfort and reliability.A development announced in June 2024 introduced AI‑powered analytics that automatically balances load distribution across multiple meters, improving overall efficiency and supporting the market’s shift toward smarter, data‑driven building operations.
Market snapshot - (2026-2033)
Global Market Size
USD 9.42 Billion
Largest Segment
Three-Phase Power Meters
Fastest Growth
Multifunction Power Meters
Growth Rate
8.4% CAGR
To get more insights on this market click here to Request a Free Sample Report
Global building automation power meter market is segmented by meter type, measurement parameter, communication protocol, application, building type and region. Based on meter type, the market is segmented into Single-Phase Power Meters, Three-Phase Power Meters and Multifunction Power Meters. Based on measurement parameter, the market is segmented into Energy Consumption, Voltage, Current and Power Factor. Based on communication protocol, the market is segmented into Modbus, BACnet, KNX and Wireless. Based on application, the market is segmented into Energy Monitoring, Load Management and Power Quality Monitoring. Based on building type, the market is segmented into Commercial Buildings, Residential Buildings and Industrial Buildings. Based on region, the market is segmented into North America, Europe, Asia Pacific, Latin America and Middle East & Africa.
Three Phase Power Meters segment dominates because they directly address the complex load distribution typical of large facilities, providing precise measurement across multiple phases. Their ability to capture balanced and unbalanced loads enhances system reliability, while integrated analytics simplify fault detection. This functional depth meets the critical demand for accurate monitoring in high capacity environments, reinforcing their market leadership. Additionally, they support advanced energy management platforms that synchronize data across building automation systems, enabling proactive control strategies.
However, Multifunction Power Meters segment emerges as the most rapidly expanding area as they combine measurement, communication, and control capabilities in a single unit. Growing demand for compact solutions that reduce installation complexity and support IoT integration drives this momentum, opening new opportunities for retrofits and smart building projects.
Wireless segment dominates because it eliminates the need for extensive cabling, allowing rapid deployment across diverse building layouts. The flexibility to integrate with cloud platforms enhances real time visibility, while reduced installation costs stimulate adoption in both new constructions and retrofits. This ease of scalability aligns with the push for interoperable smart infrastructure, making wireless the preferred choice among connectivity options in the market.
On the other hand, BACnet segment is witnessing the strongest growth momentum as legacy systems transition toward standardized open protocols. Its deep integration with HVAC and lighting controls simplifies unified management, while industry endorsement accelerates vendor support. This convergence fuels broader adoption, positioning BACnet as a catalyst for comprehensive building automation ecosystems.
To get detailed segments analysis, Request a Free Sample Report
North America benefits from a mature commercial and industrial infrastructure that prioritizes energy efficiency and operational reliability. Strong research and development ecosystems foster advanced sensor technologies and integrated control platforms. Robust financing mechanisms and incentives encourage adoption across new construction and retrofit projects. A collaborative network of technology providers, system integrators, and end‑users accelerates innovation cycles and drives standardization. Moreover, regulatory frameworks emphasize sustainability and demand transparent energy consumption data, reinforcing market depth and encouraging continuous investment in sophisticated power metering solutions.
Building Automation Power Meter Market in the United States thrives on extensive retrofitting initiatives in high‑rise and industrial facilities, supported by a culture of performance‑driven management. Technology partners deploy cloud‑enabled analytics that align with corporate sustainability agendas, while a competitive supplier landscape drives cost‑effective solutions. The emphasis on real‑time data empowers facilities managers to fine‑tune loads, reduce waste, and demonstrate compliance with evolving environmental standards.
Building Automation Power Meter Market in Canada is propelled by a strong focus on green building certification and demand response programs across commercial sectors. Collaborative projects between utilities and technology firms promote interoperable platforms that simplify deployment. Cold climate considerations drive innovations in sensor accuracy and durability, ensuring reliable measurement under extreme conditions. Stakeholder commitment to reducing operational footprints sustains steady demand for sophisticated metering and analytics capabilities.
Europe’s expansion is anchored by rigorous energy‑performance directives that require precise consumption monitoring across the built environment. A high density of historical building stock creates substantial retrofitting opportunities, prompting integrated solutions that blend legacy systems with modern analytics. Diverse industrial clusters demand customized metering for process optimization, while a strong sustainability ethos fuels continuous investment in low‑carbon technologies. Collaborative research hubs and a well‑established standards ecosystem nurture innovation, enabling seamless integration of power meters into broader building management frameworks and reinforcing Europe’s leadership in energy‑aware architecture.
Building Automation Power Meter Market in Germany benefits from a deep engineering heritage and a proactive approach to energy legislation that encourages tight monitoring of power use. Manufacturers prioritize precision and reliability, aligning products with stringent national standards. The country's emphasis on Industry 4.0 drives the integration of metering data with automated production controls, delivering measurable efficiency gains. Close cooperation between utilities, technology firms, and research institutes accelerates the rollout of advanced metering infrastructure across commercial and industrial sites.
Building Automation Power Meter Market in the United Kingdom experiences swift adoption driven by aggressive decarbonization goals and a vibrant smart‑city agenda. Policy incentives motivate owners of office towers and public buildings to install intelligent metering that feeds real‑time dashboards for occupants and facility managers. The market is characterized by rapid uptake of open‑protocol solutions that enable cross‑vendor compatibility, fostering a dynamic ecosystem of service providers. Continuous focus on reducing carbon footprints sustains momentum for sophisticated power measurement and analytics deployments.
Building Automation Power Meter Market in France is emerging amid strong governmental emphasis on energy renovation of historic and modern properties. Incentive schemes support the integration of meters that provide granular visibility into consumption patterns, essential for achieving national efficiency targets. Local firms are developing user‑friendly interfaces that translate data into actionable insights for building operators. Collaborative projects between research institutions and industry are nurturing innovative metering technologies tailored to the French regulatory environment, reinforcing the market’s growth trajectory.
Asia Pacific advances its position through a convergence of rapid urbanization, expanding commercial real estate, and a heightened awareness of operational cost control. Nations in the region prioritize smart‑infrastructure initiatives that embed power metering within comprehensive building automation strategies. Growing expertise in semiconductor design and IoT connectivity fuels the development of low‑power, high‑resolution devices suited to dense building environments. Partnerships between multinational technology firms and local system integrators accelerate knowledge transfer, while policy incentives encourage adoption in both new constructions and large‑scale retrofits, collectively elevating the region’s market relevance.
Building Automation Power Meter Market in Japan leverages a culture of precision engineering and a longstanding commitment to energy management in high‑rise office and manufacturing complexes. Advanced data analytics platforms are integrated with metering hardware to support predictive maintenance and fine‑grained load optimization. Collaboration between utilities and technology providers promotes demand‑response programs that rely on accurate power measurement. Continuous focus on reducing energy intensity across sectors sustains robust demand for sophisticated metering solutions.
Building Automation Power Meter Market in South Korea is propelled by aggressive smart‑city development and a strong manufacturing base seeking real‑time energy insight. Governmental frameworks encourage the deployment of interoperable metering solutions that connect seamlessly with broader building management systems. Domestic technology champions specialize in compact, high‑accuracy sensors tailored for dense urban environments. Emphasis on data‑driven decision making empowers facility operators to align energy consumption with sustainability objectives, reinforcing the market’s upward trajectory.
To know more about the market opportunities by region and country, click here to
Buy The Complete Report
Increasing Energy Efficiency Regulations
Enterprises are adopting building automation power meters to achieve stringent energy efficiency targets, as these devices deliver precise consumption data that enables continuous performance optimization, fault detection, and informed decision‑making; the resulting operational savings and sustainability credentials further motivate investment, while regulatory pressures reinforce the strategic value of real‑time monitoring across commercial and industrial facilities, thereby accelerating market expansion. Additionally, integration with existing building management systems simplifies deployment and enhances scalability, fostering broader acceptance among facility managers and encouraging long‑term commitments to energy‑saving initiatives.
Integration With IoT Platforms
Manufacturers are leveraging IoT platforms to embed power meters within connected building ecosystems, allowing seamless data exchange, remote configuration, and advanced analytics; this interoperability enhances predictive maintenance capabilities and supports scalable energy management solutions, which in turn attracts stakeholders seeking holistic automation strategies, thereby reinforcing market momentum and encouraging continuous product innovation across the sector. The unified communication standards reduce integration complexity, enabling faster deployment cycles and fostering confidence among end‑users, while real‑time insights derived from cloud‑based platforms drive strategic energy reductions and operational excellence across diverse commercial environments.
High Initial Investment Cost
The upfront capital required for advanced building automation power meters, including sensor hardware, communication modules, and integration services, remains substantial, often deterring organizations with limited budget allocations; this financial barrier slows adoption rates, particularly among small and mid‑size enterprises that prioritize immediate operational expenditures over long‑term energy savings, thereby constraining overall market growth despite recognized efficiency benefits. Furthermore, the lack of standardized financing models and the perceived risk of technology obsolescence amplify hesitation, prompting decision‑makers to defer investments until clearer ROI evidence emerges, which prolongs the market’s maturation timeline.
Complex Installation and Maintenance
Deploying power meters within existing building infrastructures often involves intricate wiring, calibration, and coordination with legacy control systems, which can be time‑consuming and require specialized expertise; this complexity raises installation costs and extends commissioning periods, discouraging organizations seeking rapid rollouts, while ongoing maintenance demands frequent software updates and sensor replacements, adding operational burdens that may outweigh perceived benefits and thus temper market adoption rates. Moreover, requirement for recalibration to maintain data accuracy imposes resource allocation, and the availability of trained personnel in many regions further prolongs timelines, collectively constraining deployment.
Request Free Customization of this report to help us to meet your business objectives.
The competitive landscape is shaped by aggressive investment and partnership moves, with incumbents leveraging venture funds and utility pilots to outpace rivals; Schneider Electric’s SE Ventures has deployed a billion‑Euro fund to back AI‑enabled power‑meter innovators, while PG&E’s Next Generation Meter program accelerates smart‑meter rollouts, intensifying pressure on traditional BAS suppliers.
Top Player’s Company Profile
Recent Developments
SkyQuest’s ABIRAW (Advanced Business Intelligence, Research & Analysis Wing) is our Business Information Services team that Collects, Collates, Correlates, and Analyses the Data collected by means of Primary Exploratory Research backed by robust Secondary Desk research. As per SkyQuest analysis the global building automation power meter market is being propelled primarily by tightening energy‑efficiency regulations that compel owners to install precise meters for compliance and cost savings, while a second strong catalyst is the seamless integration of meters with IoT platforms that unlocks real‑time analytics and predictive maintenance. The market is led by North America where mature infrastructure, incentives and standards drive adoption, and the three‑phase power meter segment dominates because it meets the complex load‑balancing needs of large facilities. However, high upfront investment costs remain a notable restraint, slowing uptake among budget‑conscious firms in the near term, limiting rapid expansion.
| Report Metric | Details |
|---|---|
| Market size value in 2024 | USD 9.42 Billion |
| Market size value in 2033 | USD 19.47 Billion |
| Growth Rate | 8.4% |
| Base year | 2024 |
| Forecast period | (2026-2033) |
| Forecast Unit (Value) | USD Billion |
| Segments covered |
|
| Regions covered | North America (US, Canada), Europe (Germany, France, United Kingdom, Italy, Spain, Rest of Europe), Asia Pacific (China, India, Japan, Rest of Asia-Pacific), Latin America (Brazil, Rest of Latin America), Middle East & Africa (South Africa, GCC Countries, Rest of MEA) |
| Companies covered |
|
| Customization scope | Free report customization with purchase. Customization includes:-
|
To get a free trial access to our platform which is a one stop solution for all your data requirements for quicker decision making. This platform allows you to compare markets, competitors who are prominent in the market, and mega trends that are influencing the dynamics in the market. Also, get access to detailed SkyQuest exclusive matrix.
Table Of Content
Executive Summary
Market overview
Parent Market Analysis
Market overview
Market size
KEY MARKET INSIGHTS
COVID IMPACT
MARKET DYNAMICS & OUTLOOK
Market Size by Region
KEY COMPANY PROFILES
Methodology
For the Building Automation Power Meter Market, our research methodology involved a mixture of primary and secondary data sources. Key steps involved in the research process are listed below:
1. Information Procurement: This stage involved the procurement of Market data or related information via primary and secondary sources. The various secondary sources used included various company websites, annual reports, trade databases, and paid databases such as Hoover's, Bloomberg Business, Factiva, and Avention. Our team did 45 primary interactions Globally which included several stakeholders such as manufacturers, customers, key opinion leaders, etc. Overall, information procurement was one of the most extensive stages in our research process.
2. Information Analysis: This step involved triangulation of data through bottom-up and top-down approaches to estimate and validate the total size and future estimate of the Building Automation Power Meter Market.
3. Report Formulation: The final step entailed the placement of data points in appropriate Market spaces in an attempt to deduce viable conclusions.
4. Validation & Publishing: Validation is the most important step in the process. Validation & re-validation via an intricately designed process helped us finalize data points to be used for final calculations. The final Market estimates and forecasts were then aligned and sent to our panel of industry experts for validation of data. Once the validation was done the report was sent to our Quality Assurance team to ensure adherence to style guides, consistency & design.
Analyst Support
Customization Options
With the given market data, our dedicated team of analysts can offer you the following customization options are available for the Building Automation Power Meter Market:
Product Analysis: Product matrix, which offers a detailed comparison of the product portfolio of companies.
Regional Analysis: Further analysis of the Building Automation Power Meter Market for additional countries.
Competitive Analysis: Detailed analysis and profiling of additional Market players & comparative analysis of competitive products.
Go to Market Strategy: Find the high-growth channels to invest your marketing efforts and increase your customer base.
Innovation Mapping: Identify racial solutions and innovation, connected to deep ecosystems of innovators, start-ups, academics, and strategic partners.
Category Intelligence: Customized intelligence that is relevant to their supply Markets will enable them to make smarter sourcing decisions and improve their category management.
Public Company Transcript Analysis: To improve the investment performance by generating new alpha and making better-informed decisions.
Social Media Listening: To analyze the conversations and trends happening not just around your brand, but around your industry as a whole, and use those insights to make better Marketing decisions.
REQUEST FOR SAMPLE
 REQUEST FREE CUSTOMIZATION


Want to customize this report? This report can be personalized according to your needs. Our analysts and industry experts will work directly with you to understand your requirements and provide you with customized data in a short amount of time. We offer $1000 worth of FREE customization at the time of purchase.
Feedback From Our Clients


 USA (+1) 351-333-4748

