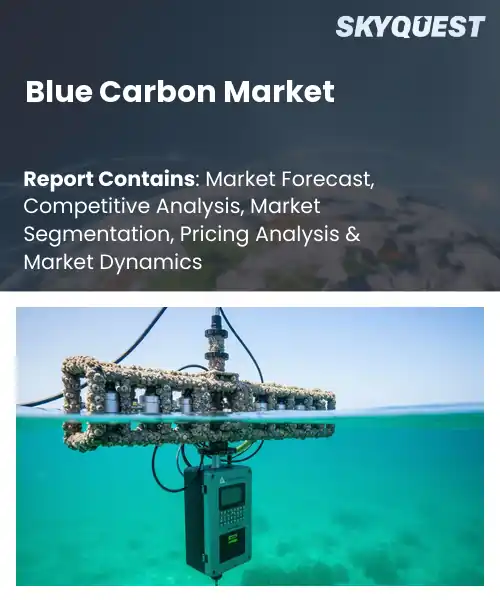
Blue Carbon Market
Report ID: SQMIG20L2095
Report ID: SQMIG20L2095
[email protected]
USA +1 351-333-4748
Report ID:
SQMIG20L2095 |
Region:
Global |
Published Date: July, 2026
Pages:
157
|Tables:
128
|Figures:
77


Global Blue Carbon Market size was valued at USD 1.2 Billion in 2024 and is poised to grow from USD 1.49 Billion in 2025 to USD 8.32 Billion by 2033, growing at a CAGR of 24.0% during the forecast period (2026-2033).
The blue carbon market captures the value of carbon sequestered by coastal ecosystems such as mangroves, saltmarshes, and seagrass beds. Its primary driver is the urgent need to meet national net‑zero pledges while protecting biodiversity, prompting governments to recognize these habitats as verifiable emission offsets. Historically, the market emerged from early voluntary projects in Southeast Asia where mangrove restoration earned credits under the Clean Development Mechanism. Over the past decade, standards like the Verified Carbon Standard and the International Blue Carbon Initiative have formalized methodologies, allowing firms to purchase credits that fund restoration, thereby linking climate mitigation with coastal resilience. The blue carbon market expands because policy incentives, sustainability mandates, and climate finance converge to create demand for solutions. When governments embed coastal carbon accounting into their Nationally Determined Contributions, firms seeking offsets turn to projects that promise emission reductions and ecosystem services, driving investment toward restoration enterprises. An example is the partnership between a European shipping consortium and a Kenyan mangrove reforestation program, where purchased credits offset vessel emissions while enhancing fisheries and tourism revenue. This cause‑effect chain amplifies market size, attracts capital, and spurs innovation in verification tools, positioning blue carbon as a scalable pillar of the economy.
How is blockchain technology improving verification and trading in the blue carbon market?
Blockchain brings immutable records to blue carbon projects, allowing each ton of carbon stored in mangroves, seagrasses or tidal marshes to be traced from field measurement to market sale. Smart contracts automate verification steps, linking satellite imagery, sensor data and third‑party audits to a shared ledger that all participants can audit in real time. This reduces reliance on paper certificates, cuts administrative lag, and builds confidence among buyers who can instantly confirm a credit’s provenance. As voluntary markets expand, the technology also supports cross‑border trading by standardising data formats and enabling seamless settlement without intermediaries, making the market more accessible and resilient.Ecosystem Marketplace, April 2025, highlighted a blockchain‑enabled verification pilot that streamlines credit issuance and trading, demonstrating how the technology can accelerate market growth and improve efficiency.
Market snapshot - (2026-2033)
Global Market Size
USD 1.2 Billion
Largest Segment
Mangroves
Fastest Growth
Kelp
Growth Rate
24.0% CAGR
To get more insights on this market click here to Request a Free Sample Report
Global blue carbon market is segmented by ecosystem type, application, transaction type, end-user buyer group and region. Based on ecosystem type, the market is segmented into Mangroves, Blue Mangrove Forests, Seagrass Meadows, Salt Marshes, Tidal Wetlands, Kelp, Seaweed and Others. Based on application, the market is segmented into Carbon Credits Procurement, Offset Procurement, Conservation Finance, Government Programs, Corporate Net-Zero Programs and Others. Based on transaction type, the market is segmented into Voluntary Carbon Markets and Compliance Carbon Markets. Based on end-user buyer group, the market is segmented into Energy Corporations, Technology Firms, Financial Institutions, Aviation Companies, Logistics Companies, Institutional Investors and Others. Based on region, the market is segmented into North America, Europe, Asia Pacific, Latin America and Middle East & Africa.
Mangroves segment dominates because they provide the highest carbon sequestration density, are relatively well mapped, and attract investors seeking tangible verifiable outcomes. Their treeroot structure locks carbon for centuries, and the presence of established restoration protocols reduces perceived risk, encouraging both voluntary and compliance buyers to prioritize projects centered on mangrove ecosystems. Furthermore, community involvement and co benefits such as coastline protection and fisheries support broaden stakeholder appeal, solidifying mangroves as the cornerstone of Blue Carbon financing.
However, Seagrass Meadows segment emerges as the most rapidly expanding area because recent advances in underwater monitoring and the recognition of its high per area carbon capture have spurred new project pipelines. Growing demand for coastal resilience and fisheries co benefits accelerates investment, positioning seagrass restoration as a catalyst for future market expansion.
Carbon Credits Procurement segment leads because it directly connects project revenues to market demand, offering a clear financial pathway for developers. Buyers prioritize verified credits, which drives rigorous monitoring and reporting standards, enhancing overall market credibility. The ability to monetize sequestration through tradable units creates scalable business models, attracting both voluntary participants and compliance entities, thereby anchoring the Blue Carbon market around credit generation and fostering long term investment confidence.
Meanwhile, Conservation Finance segment is witnessing the strongest growth momentum as philanthropic capital and impact focused investors seek bundled solutions that combine carbon sequestration with biodiversity protection. Innovative financing structures such as blended finance and green bonds unlock new sources of funding, expanding the pipeline of projects that can deliver multiple ecosystem services and amplifying market depth.
To get detailed segments analysis, Request a Free Sample Report
Europe’s dominance stems from a cohesive regulatory environment that integrates blue carbon objectives into broader climate policies. Robust public funding mechanisms, combined with a tradition of collaborative research across universities and coastal agencies, create a supportive ecosystem for restoration projects. The region benefits from mature financial markets that provide confidence to investors seeking nature‑based solutions. Strong civil‑society engagement and heightened public awareness reinforce demand for credible carbon credits. Additionally, European coastal nations leverage extensive shorelines and diverse habitats, positioning themselves as leaders in science‑driven project design and verification, which in turn attracts multinational partnerships and reinforces market credibility.
Blue Carbon Market activity in Germany is anchored by interdisciplinary research institutions that advance restoration science and monitoring standards. Federal and state programs allocate resources to mangrove analogues, saltmarsh, and seagrass initiatives, fostering a pipeline of high‑quality projects. Private sector participation grows as corporations integrate nature‑based offsets into sustainability strategies, while financial institutions develop bespoke carbon products that reference German‑validated methodologies.
Blue Carbon Market development in the United Kingdom leverages its extensive coastal research heritage and strong policy alignment with national climate commitments. Government agencies collaborate with NGOs to pilot restoration of estuarine habitats, creating early‑stage projects that demonstrate scalable impact. Industry players increasingly view blue carbon credits as a pathway to meeting voluntary net‑zero pledges, supported by rigorous verification protocols established by UK scientific bodies.
Blue Carbon Market progress in France is driven by a combination of coastal management expertise and a proactive approach to integrating marine ecosystems into carbon accounting frameworks. National research labs contribute cutting‑edge data that inform project design, while coastal regions benefit from targeted funding streams encouraging habitat rehabilitation. Corporate sustainability programs incorporate French‑certified blue carbon offsets, reinforcing market depth and aligning with broader European climate ambitions.
The north‑american expansion is propelled by a convergence of federal incentives, state‑level climate action plans, and heightened corporate demand for credible nature‑based offsets. A growing recognition of coastal ecosystems’ role in climate resilience fuels public and private investment in restoration projects. Innovative financing structures enable private capital to flow into early‑stage initiatives, while research institutions provide the scientific rigor required for market credibility. Collaborative platforms among governments, NGOs, and industry stakeholders accelerate knowledge sharing, creating a fertile environment for scalable project pipelines that meet evolving sustainability expectations.
Blue Carbon Market efforts in the United States benefit from a diverse portfolio of coastal habitats ranging from marshes to kelp forests, each supported by federal programs that emphasize ecosystem services. Universities and research centers lead advances in monitoring and verification, ensuring that projects meet high standards of integrity. Corporate sustainability agendas increasingly incorporate U.S.‑based blue carbon credits, motivated by stakeholder pressure and the desire to align with ambitious climate goals, while financial innovators craft tailored investment vehicles that bridge capital to restoration sites.
Blue Carbon Market activity in Canada focuses on the preservation and restoration of its extensive shoreline and boreal coastal wetlands. Government initiatives prioritize the integration of blue carbon into national climate strategies, offering supportive policy frameworks for project developers. Indigenous partnerships play a pivotal role, combining traditional knowledge with scientific methods to enhance project outcomes. Private enterprises source Canadian‑validated credits to complement broader carbon portfolios, reflecting confidence in the region’s rigorous verification processes.
Asia Pacific is strengthening its position by embedding blue carbon into national climate mitigation strategies and capitalizing on the region’s rich coastal biodiversity. Growing policy attention on mangrove and seagrass restoration aligns with broader economic objectives of coastal resilience and sustainable development. Technological innovation, including remote sensing and data analytics, enhances project monitoring and verification, building trust among buyers. Regional cooperation through multilateral forums facilitates the exchange of best practices, while private investors increasingly recognize the dual climate and social benefits of blue carbon projects, driving momentum across the market.
Blue Carbon Market initiatives in Japan concentrate on integrating coastal restoration with disaster risk reduction and marine ecosystem health. Government agencies provide targeted support for projects that blend traditional knowledge with advanced scientific monitoring, ensuring robust outcomes. Corporate sustainability programs actively seek Japanese‑certified blue carbon credits as part of comprehensive net‑zero pathways, while research institutions advance methodologies that underpin market credibility and foster international collaboration.
Blue Carbon Market development in South Korea leverages its strategic focus on marine biodiversity and blue‑economy growth. National policies incentivize the rehabilitation of tidal flats and coastal wetlands, creating a supportive environment for project developers. Academic and private sector partnerships drive innovation in measurement techniques, enhancing the transparency of carbon accounting. Companies incorporate South Korean blue carbon offsets to meet ambitious climate pledges, reinforcing the country's emerging role as a credible supplier in the global market.
To know more about the market opportunities by region and country, click here to
Buy The Complete Report
Increasing Corporate Climate Commitments
Policy Incentives Driving Restoration Projects
Unclear Carbon Accounting Standards
Land Tenure and Community Rights
Request Free Customization of this report to help us to meet your business objectives.
The blue carbon market is shaped by intense competition as firms race to secure financing, forge cross‑border partnerships, and deploy innovative restoration technologies; recent M&A activity and strategic alliances are accelerating ecosystem‑scale projects, while tech‑driven monitoring platforms are differentiating players and attracting capital.
Top Player’s Company Profile
Recent Developments
SkyQuest’s ABIRAW (Advanced Business Intelligence, Research & Analysis Wing) is our Business Information Services team that Collects, Collates, Correlates, and Analyses the Data collected by means of Primary Exploratory Research backed by robust Secondary Desk research. As per SkyQuest analysis the global blue carbon market is expanding rapidly driven primarily by increasing corporate climate commitments that push firms toward verifiable nature‑based offsets, while supportive policy incentives that fund restoration projects form a second catalyst. Europe emerges as the dominating region thanks to cohesive regulations, public funding and strong research networks, and mangroves constitute the dominant segment because of their high sequestration density and well‑established restoration protocols. However, the lack of universally accepted carbon accounting standards remains a key restraint, creating valuation uncertainty and slowing large‑scale financing. Together these forces shape a market projected to grow from $1.49 billion in 2025 to $8.32 billion by 2033.
| Report Metric | Details |
|---|---|
| Market size value in 2024 | USD 1.2 Billion |
| Market size value in 2033 | USD 8.32 Billion |
| Growth Rate | 24.0% |
| Base year | 2024 |
| Forecast period | (2026-2033) |
| Forecast Unit (Value) | USD Billion |
| Segments covered |
|
| Regions covered | North America (US, Canada), Europe (Germany, France, United Kingdom, Italy, Spain, Rest of Europe), Asia Pacific (China, India, Japan, Rest of Asia-Pacific), Latin America (Brazil, Rest of Latin America), Middle East & Africa (South Africa, GCC Countries, Rest of MEA) |
| Companies covered |
|
| Customization scope | Free report customization with purchase. Customization includes:-
|
To get a free trial access to our platform which is a one stop solution for all your data requirements for quicker decision making. This platform allows you to compare markets, competitors who are prominent in the market, and mega trends that are influencing the dynamics in the market. Also, get access to detailed SkyQuest exclusive matrix.
Table Of Content
Executive Summary
Market overview
Parent Market Analysis
Market overview
Market size
KEY MARKET INSIGHTS
COVID IMPACT
MARKET DYNAMICS & OUTLOOK
Market Size by Region
KEY COMPANY PROFILES
Methodology
For the Blue Carbon Market, our research methodology involved a mixture of primary and secondary data sources. Key steps involved in the research process are listed below:
1. Information Procurement: This stage involved the procurement of Market data or related information via primary and secondary sources. The various secondary sources used included various company websites, annual reports, trade databases, and paid databases such as Hoover's, Bloomberg Business, Factiva, and Avention. Our team did 45 primary interactions Globally which included several stakeholders such as manufacturers, customers, key opinion leaders, etc. Overall, information procurement was one of the most extensive stages in our research process.
2. Information Analysis: This step involved triangulation of data through bottom-up and top-down approaches to estimate and validate the total size and future estimate of the Blue Carbon Market.
3. Report Formulation: The final step entailed the placement of data points in appropriate Market spaces in an attempt to deduce viable conclusions.
4. Validation & Publishing: Validation is the most important step in the process. Validation & re-validation via an intricately designed process helped us finalize data points to be used for final calculations. The final Market estimates and forecasts were then aligned and sent to our panel of industry experts for validation of data. Once the validation was done the report was sent to our Quality Assurance team to ensure adherence to style guides, consistency & design.
Analyst Support
Customization Options
With the given market data, our dedicated team of analysts can offer you the following customization options are available for the Blue Carbon Market:
Product Analysis: Product matrix, which offers a detailed comparison of the product portfolio of companies.
Regional Analysis: Further analysis of the Blue Carbon Market for additional countries.
Competitive Analysis: Detailed analysis and profiling of additional Market players & comparative analysis of competitive products.
Go to Market Strategy: Find the high-growth channels to invest your marketing efforts and increase your customer base.
Innovation Mapping: Identify racial solutions and innovation, connected to deep ecosystems of innovators, start-ups, academics, and strategic partners.
Category Intelligence: Customized intelligence that is relevant to their supply Markets will enable them to make smarter sourcing decisions and improve their category management.
Public Company Transcript Analysis: To improve the investment performance by generating new alpha and making better-informed decisions.
Social Media Listening: To analyze the conversations and trends happening not just around your brand, but around your industry as a whole, and use those insights to make better Marketing decisions.
REQUEST FOR SAMPLE
 REQUEST FREE CUSTOMIZATION


Want to customize this report? This report can be personalized according to your needs. Our analysts and industry experts will work directly with you to understand your requirements and provide you with customized data in a short amount of time. We offer $1000 worth of FREE customization at the time of purchase.
Feedback From Our Clients


 USA (+1) 351-333-4748

