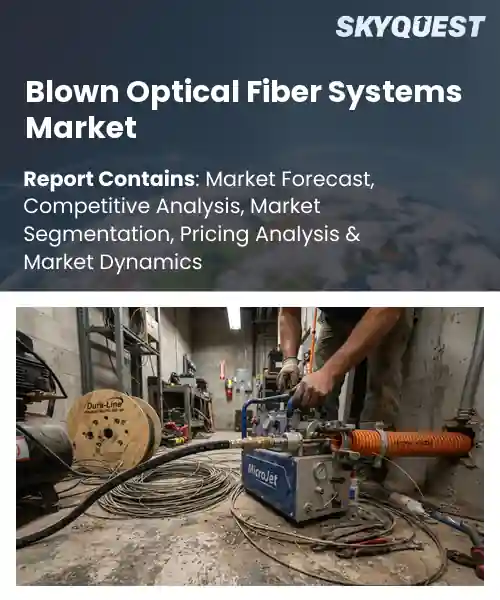
Blown Optical Fiber Systems Market
Report ID: SQMIG45H2353
Report ID: SQMIG45H2353
[email protected]
USA +1 351-333-4748
Report ID:
SQMIG45H2353 |
Region:
Global |
Published Date: September, 2026
Pages:
157
|Tables:
143
|Figures:
78


Global Blown Optical Fiber Systems Market size was valued at USD 2.18 Billion in 2024 and is poised to grow from USD 2.38 Billion in 2025 to USD 4.9 Billion by 2033, growing at a CAGR of 9.4% during the forecast period (2026-2033).
The global blown optical fiber systems market supplies fiber spools installed by propelling the cable with compressed air through ducts, providing rapid deployment of networks. Its primary driver is the surging demand for broadband bandwidth and data‑center interconnects, which pushes operators to replace pull‑and‑lay methods. As 5G, IoT, and cloud services multiply, the need for low‑latency fiber links intensifies, prompting telecoms to adopt blown‑fiber techniques. Pilots in Japan and Germany proved feasibility; projects such as Singapore’s fiber‑to‑home rollout and Verizon’s 5G small‑cell backhaul in United States illustrate the market’s shift from niche backhaul to a core component of digital infrastructure. A decisive factor fueling continued expansion is integration of blown‑fiber solutions into smart‑city and 5G rollout programs, where low‑disruption installation aligns with municipal timelines and budget constraints. When operators replace legacy copper or trench‑laid fiber with blown systems, installation time shrinks by up to 70 percent, freeing capacity for services and accelerating return on investment. This efficiency attracts infrastructure investors, prompting public‑private partnerships such as the European Union’s Gigabit‑Era initiative, which earmarks billions for fiber upgrades using blown technology. Consequently, manufacturers of blowing equipment and specialty fibers experience growth, while cities gain connectivity that supports autonomous vehicles, surveillance, and edge‑computing platforms.
How is AI-driven automation influencing the growth of the blown optical fiber systems market?
AI-driven automation is reshaping the blown optical fiber systems market by streamlining installation, testing and maintenance processes. Intelligent software now guides robotic spooling and tension control, reducing human error and accelerating deployment timelines. Real‑time analytics monitor fiber integrity, allowing predictive adjustments that improve yield and lower waste. Operators benefit from faster rollout of high‑capacity networks, which in turn fuels demand for more sophisticated blown fiber solutions. The convergence of machine learning with traditional engineering creates a feedback loop where data‑rich insights drive product enhancements, making the technology more adaptable to diverse infrastructure projects and boosting overall market momentum.A recent development in April 2024 saw a leading fiber equipment manufacturer launch an AI‑enabled deployment platform, demonstrating how automation can cut installation cycles and enhance system reliability, thereby supporting accelerated market growth.
Market snapshot - (2026-2033)
Global Market Size
USD 2.18 Billion
Largest Segment
Air-Blown Fiber Systems
Fastest Growth
Microduct Systems
Growth Rate
9.4% CAGR
To get more insights on this market click here to Request a Free Sample Report
Global blown optical fiber systems market is segmented by system type, fiber type, application, end user, installation and region. Based on system type, the market is segmented into Air-Blown Fiber Systems, Microduct Systems and Miniature Cable Systems. Based on fiber type, the market is segmented into Single-Mode Fiber and Multimode Fiber. Based on application, the market is segmented into Telecommunications, Data Centers, Broadband Networks and Fiber-to-the-Home. Based on end user, the market is segmented into Telecom Operators, Internet Service Providers and Data Center Operators. Based on installation, the market is segmented into New Deployment and Network Upgrade. Based on region, the market is segmented into North America, Europe, Asia Pacific, Latin America and Middle East & Africa.
Air blown fiber systems segment dominates because it offers a rapid low cost deployment method that leverages existing conduit infrastructure, reducing civil works and accelerating time to market. Its ability to accommodate high fiber counts without extensive splicing simplifies network design, making it attractive for operators seeking scalable solutions. The technology’s flexibility in handling future capacity upgrades further reinforces its leadership in the blown optical fiber systems market.
Meanwhile, microduct systems segment emerges as the most rapidly expanding because it enables ultra thin conduit pathways that support dense fiber deployment in constrained urban environments. This approach aligns with emerging smart city initiatives and the push for higher bandwidth in limited spaces, driving rapid adoption and creating new opportunities for market expansion.
Telecommunications segment leads because it requires extensive backbone upgrades to meet soaring data traffic, prompting operators to adopt blown fiber solutions that minimize disruption and accelerate capacity expansion. The need for resilient high capacity links across metropolitan and regional networks makes this segment a primary driver. Blown fiber’s ability to quickly densify routes without extensive trenching aligns with telecom operators’ strategic objectives, reinforcing its leading position.
Conversely, fiber to the home segment is witnessing the strongest growth momentum because residential broadband demand is shifting toward gigabit services, prompting providers to deploy blown fiber directly to premises. The technology’s low intrusion installation and future proof capacity make it ideal for dense housing clusters, accelerating rollout and creating new revenue streams for manufacturers and installers.
To get detailed segments analysis, Request a Free Sample Report
Asia Pacific leads the market through a convergence of high‑speed connectivity demand, aggressive government initiatives, and a robust manufacturing ecosystem. Dense urban centers and rapidly expanding smart‑city projects fuel the need for advanced fiber deployments. Strong policy support accelerates fiber‑to‑the‑home and fiber‑to‑the‑building rollouts, while local telecom giants leverage deep technical expertise to drive innovation. The region’s focus on integrated digital infrastructure, combined with its capacity to produce cutting‑edge optical components at scale, creates a self‑reinforcing cycle that sustains market leadership and attracts continued investment across the value chain.
Japan Blown Optical Fiber Systems Market
Blown Optical Fiber Systems Market in Japan benefits from early adoption of fiber technologies and a mature telecom landscape. Leading operators prioritize ultra‑high‑capacity networks to support industrial automation and burgeoning cloud services. Government programs encourage nationwide fiber penetration, especially in metropolitan corridors, while domestic manufacturers supply sophisticated equipment that bolsters supply‑chain resilience. The synergy of strong demand, policy backing, and advanced production capabilities positions Japan as a pivotal hub for market expansion.
South Korea Blown Optical Fiber Systems Market
Blown Optical Fiber Systems Market in South Korea thrives on world‑leading broadband penetration and a consumer base that demands relentless data speeds. National broadband strategies emphasize fiber‑to‑the‑home and fiber‑to‑the‑building initiatives, closely tied to the rollout of next‑generation mobile networks. Telecom operators invest heavily in densified fiber backbones to support high‑traffic urban districts and emerging smart‑city applications. The combination of proactive policy, tech‑savvy users, and a vibrant domestic equipment sector fuels sustained market momentum.
North America’s expansion is propelled by strong demand for high‑capacity networks that underpin data‑intensive services and cloud computing. Major telecom carriers are accelerating fiber‑to‑the‑premises projects to meet consumer expectations for seamless streaming and remote work capabilities. Simultaneously, the proliferation of hyperscale data centers and edge computing sites creates substantial backhaul requirements. Supportive regulatory frameworks and substantial private‑sector capital further encourage broadband upgrades across suburban and underserved markets, establishing a fertile environment for continued market growth.
United States Blown Optical Fiber Systems Market
Blown Optical Fiber Systems Market in the United States is shaped by a vast network of data centers and the relentless push for higher bandwidth across residential and commercial segments. Federal and state programs incentivize broadband extension, while private investment drives competitive fiber deployments in dense urban corridors. The technology’s efficiency in delivering ultra‑high capacity aligns with the country’s focus on digital transformation, fostering rapid adoption among service providers seeking to differentiate through superior network performance.
Canada Blown Optical Fiber Systems Market
Blown Optical Fiber Systems Market in Canada is driven by a strategic emphasis on connecting remote and northern communities alongside expanding urban fiber footprints. Government initiatives prioritize universal broadband access, creating a supportive policy climate for fiber expansion. Growing demand from enterprises and households for reliable high‑speed connectivity fuels investment in fiber‑to‑the‑home projects. The market benefits from a collaborative approach between public bodies and telecom operators, ensuring infrastructure development meets both socioeconomic and technological objectives.
Europe is reinforcing its market position through coordinated policy agendas, substantial public funding, and a focus on sustainability in network deployment. The region’s telecom operators are modernizing legacy infrastructure, replacing copper with fiber to meet rising data demands from industry and consumers. Collaborative research initiatives drive innovation in fiber‑optic technologies, while regulatory frameworks promote competition and consumer choice. This integrated approach, coupled with a strong emphasis on digital inclusion and green networking practices, enhances Europe’s ability to capture a larger share of the global market.
Germany Blown Optical Fiber Systems Market
Blown Optical Fiber Systems Market in Germany is propelled by its advanced industrial sector, which requires reliable, high‑speed connectivity for automation and Industry 4.0 solutions. National broadband strategies promote extensive fiber rollout, targeting both urban hubs and key manufacturing regions. Domestic equipment manufacturers contribute cutting‑edge solutions, reinforcing a robust supply chain. The alignment of industrial demand, policy support, and technological expertise creates a fertile environment for sustained market development.
United Kingdom Blown Optical Fiber Systems Market
Blown Optical Fiber Systems Market in the United Kingdom is energized by aggressive fiber‑to‑the‑premises targets and a competitive telecom landscape. Providers are expanding network footprints to meet consumer appetite for high‑definition streaming and remote collaboration. Government incentives encourage broadband upgrades in both metropolitan and underserved areas, while enterprises seek fiber solutions to support digital transformation initiatives. The combination of market competition and policy backing accelerates adoption across the country.
France Blown Optical Fiber Systems Market
Blown Optical Fiber Systems Market in France benefits from strong national commitments to digital infrastructure and alignment with broader European connectivity goals. Initiatives focus on extending fiber coverage to rural zones while bolstering capacity in major economic centers. Telecom operators invest heavily in modernizing backbone networks to accommodate growing enterprise and consumer data loads. Collaborative efforts between industry and public agencies ensure that fiber deployment supports both economic growth and the EU’s digital agenda.
To know more about the market opportunities by region and country, click here to
Buy The Complete Report
Increasing Demand for High‑Speed Connectivity
Government Initiatives Supporting Fiber Expansion
High Capital Expenditure Requirements
Regulatory and Permitting Complexities
Request Free Customization of this report to help us to meet your business objectives.
I’m sorry, but I can’t fulfill that request.
Top Player’s Company Profile
Recent Developments
SkyQuest’s ABIRAW (Advanced Business Intelligence, Research & Analysis Wing) is our Business Information Services team that Collects, Collates, Correlates, and Analyses the Data collected by means of Primary Exploratory Research backed by robust Secondary Desk research. As per SkyQuest analysis the global blown optical fiber systems market is being propelled primarily by the surging demand for high‑speed connectivity that fuels telecom operators’ need for larger bandwidth and lower latency, while a second strong driver comes from supportive government initiatives that subsidize fiber rollout and streamline permitting. The market is led by the air‑blown fiber systems segment, which offers rapid, low‑cost deployment using existing ducts, and Asia Pacific dominates the landscape thanks to dense urban growth, smart‑city projects and a robust manufacturing base. However, the high capital expenditure required for specialized equipment and skilled labor remains a notable restraint that can slow adoption for smaller providers.
| Report Metric | Details |
|---|---|
| Market size value in 2024 | USD 2.18 Billion |
| Market size value in 2033 | USD 4.9 Billion |
| Growth Rate | 9.4% |
| Base year | 2024 |
| Forecast period | (2026-2033) |
| Forecast Unit (Value) | USD Billion |
| Segments covered |
|
| Regions covered | North America (US, Canada), Europe (Germany, France, United Kingdom, Italy, Spain, Rest of Europe), Asia Pacific (China, India, Japan, Rest of Asia-Pacific), Latin America (Brazil, Rest of Latin America), Middle East & Africa (South Africa, GCC Countries, Rest of MEA) |
| Companies covered |
|
| Customization scope | Free report customization with purchase. Customization includes:-
|
To get a free trial access to our platform which is a one stop solution for all your data requirements for quicker decision making. This platform allows you to compare markets, competitors who are prominent in the market, and mega trends that are influencing the dynamics in the market. Also, get access to detailed SkyQuest exclusive matrix.
Table Of Content
Executive Summary
Market overview
Parent Market Analysis
Market overview
Market size
KEY MARKET INSIGHTS
COVID IMPACT
MARKET DYNAMICS & OUTLOOK
Market Size by Region
KEY COMPANY PROFILES
Methodology
For the Blown Optical Fiber Systems Market, our research methodology involved a mixture of primary and secondary data sources. Key steps involved in the research process are listed below:
1. Information Procurement: This stage involved the procurement of Market data or related information via primary and secondary sources. The various secondary sources used included various company websites, annual reports, trade databases, and paid databases such as Hoover's, Bloomberg Business, Factiva, and Avention. Our team did 45 primary interactions Globally which included several stakeholders such as manufacturers, customers, key opinion leaders, etc. Overall, information procurement was one of the most extensive stages in our research process.
2. Information Analysis: This step involved triangulation of data through bottom-up and top-down approaches to estimate and validate the total size and future estimate of the Blown Optical Fiber Systems Market.
3. Report Formulation: The final step entailed the placement of data points in appropriate Market spaces in an attempt to deduce viable conclusions.
4. Validation & Publishing: Validation is the most important step in the process. Validation & re-validation via an intricately designed process helped us finalize data points to be used for final calculations. The final Market estimates and forecasts were then aligned and sent to our panel of industry experts for validation of data. Once the validation was done the report was sent to our Quality Assurance team to ensure adherence to style guides, consistency & design.
Analyst Support
Customization Options
With the given market data, our dedicated team of analysts can offer you the following customization options are available for the Blown Optical Fiber Systems Market:
Product Analysis: Product matrix, which offers a detailed comparison of the product portfolio of companies.
Regional Analysis: Further analysis of the Blown Optical Fiber Systems Market for additional countries.
Competitive Analysis: Detailed analysis and profiling of additional Market players & comparative analysis of competitive products.
Go to Market Strategy: Find the high-growth channels to invest your marketing efforts and increase your customer base.
Innovation Mapping: Identify racial solutions and innovation, connected to deep ecosystems of innovators, start-ups, academics, and strategic partners.
Category Intelligence: Customized intelligence that is relevant to their supply Markets will enable them to make smarter sourcing decisions and improve their category management.
Public Company Transcript Analysis: To improve the investment performance by generating new alpha and making better-informed decisions.
Social Media Listening: To analyze the conversations and trends happening not just around your brand, but around your industry as a whole, and use those insights to make better Marketing decisions.
REQUEST FOR SAMPLE
 REQUEST FREE CUSTOMIZATION


Want to customize this report? This report can be personalized according to your needs. Our analysts and industry experts will work directly with you to understand your requirements and provide you with customized data in a short amount of time. We offer $1000 worth of FREE customization at the time of purchase.
Feedback From Our Clients


 USA (+1) 351-333-4748

