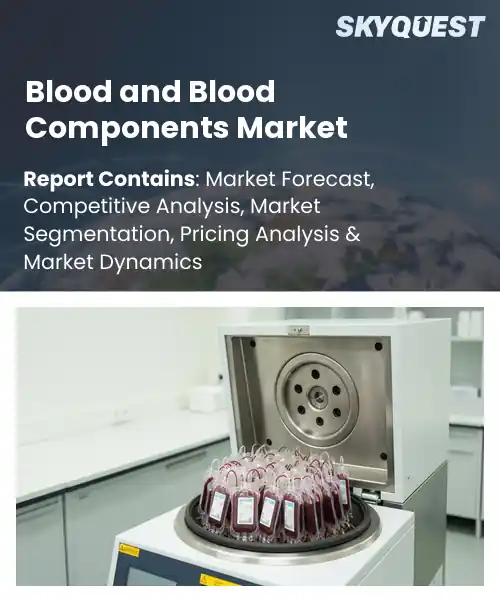
Blood and Blood Components Market
Report ID: SQMIG35D2593
Report ID: SQMIG35D2593
[email protected]
USA +1 351-333-4748
Report ID:
SQMIG35D2593 |
Region:
Global |
Published Date: July, 2026
Pages:
157
|Tables:
177
|Figures:
79


Global Blood And Blood Components Market size was valued at USD 13.1 Billion in 2024 and is poised to grow from USD 13.55 Billion in 2025 to USD 17.7 Billion by 2033, growing at a CAGR of 3.4% during the forecast period (2026-2033).
The global blood and blood components market covers the making of whole blood, red cells, plasma, platelets, and all those derived therapeutics like immunoglobulins. I mean, it matters because these products do crucial work in emergency care, chronic disease management, and during surgical procedures, not just in theory but in day-to-day treatment.
One major driver that keeps driving the global blood and blood components market growth is the faster adoption of apheresis platforms, the ones that help collect plasma‑derived biologics. In a way, this reduces the dependence on donor pools and also shortens lead times, so manufacturers can ramp up immunoglobulin and coagulation factor production when the incidence of immune deficiencies and bleeding disorders keeps rising. For example, a prominent European biotech used apheresis to handle the surge in hemophilia A therapy. That ended up with stronger revenue streams and it made investors take a closer look at adding more processing lines. So then the market gets this loop, where supply reliability improves and that encourages even more adoption, which then brings capital in.
AI is changing the blood and blood components market outlook in a more hands-off way, automating quality checks, managing inventory better, and even forecasting equipment wear before it becomes a problem. Machine‑learning models look at spectroscopic data to catch contaminants faster than manual microscopy does, sometimes earlier than people would expect. Predictive algorithms also help schedule donor collection to line up with demand spikes, so shortages are less likely. Then there are integrated sensors sending real‑time information to cloud platforms, and that supports continuous process monitoring while also enabling faster root‑cause analysis when deviations show up. As a result, waste drops, release times are shorter, and traceability stays stronger across the whole supply chain. Since hospitals keep asking for higher safety standards, manufacturers adopt AI‑based decision support to align with regulatory expectations and run operations more efficiently. And, this can lower operational costs for manufacturers worldwide, today.
Market snapshot - (2026-2033)
Global Market Size
USD 13.1 Billion
Largest Segment
Blood Components
Fastest Growth
Blood Derivatives
Growth Rate
3.4% CAGR
To get more insights on this market click here to Request a Free Sample Report
The global blood and blood components market is segmented by by product type, by collection type, by application, by end user, by storage type, by distribution channel and region. Based on by product type, the market is segmented into Whole Blood, Blood Components and Blood Derivatives. Based on by collection type, the market is segmented into Voluntary Blood Donation, Autologous Blood Collection and Apheresis Collection. Based on by application, the market is segmented into Trauma & Emergency Care, Surgeries, Cancer Treatment, Hematological Disorders, Cardiovascular Diseases, Organ Transplantation and Others. Based on by end user, the market is segmented into Hospitals, Blood Banks, Ambulatory Surgical Centers, Specialty Clinics and Others. Based on by storage type, the market is segmented into Refrigerated Blood Storage, Frozen Blood Storage and Room Temperature Storage. Based on by distribution channel, the market is segmented into Hospital-based Distribution, Regional Blood Centers and National Blood Services. Based on region, the market is segmented into North America, Europe, Asia Pacific, Latin America and Middle East & Africa.
As per the blood and blood components market analysis, the Whole Blood segment stays on top because it’s still the most basic transfusion product, covering a huge range of clinical needs from trauma resuscitation through ordinary surgeries. The fact that it already contains red cells, plasma and platelets means there’s no real need for splitting it into multiple component steps, so providers can keep inventory management in a more simple, calmer way. That ease , plus well established collection infrastructure and universal compatibility, makes demand feel steady across different healthcare settings, so it locks in its market leadership.
However, the Blood Components segment is showing the strongest growth momentum, because clinicians are more and more leaning toward focused or targeted therapy. Instead of using one mixed product, they separate red cells, plasma and platelets so they can match specific patient needs. Improvements in processing, longer shelf life, and growing awareness around reduced transfusion reactions all push adoption forward. As a result, it’s expanding quickly and also creating chances for specialized providers.
According to the blood and blood components market forecast, the Voluntary Blood Donation segment leads in a similar way, mostly because it provides most of the safe blood supply via altruistic gifting, and that lowers exposure to infectious agents that can be associated with paid collections. Public health campaigns , strong donor screening and community engagement help maintain a dependable donor base, keeping supply available for both routine care and emergencies. This ethical and regulatory fit helps maintain trust with clinicians and patients, so it stays firmly preeminent in the market.
Meanwhile, Apheresis Collection is emerging as a faster-growing area since specialized therapies often need concentrated platelets, plasma proteins, or even white blood cells. Better technology refinements help streamline processing, and they can shorten the procedure time, which matters in busy clinical workflows. Also, heightened awareness of benefits in oncology and immunotherapy is lifting demand. So the use cases keep widening, which boosts market uptake and encourages further investment in apheresis infrastructure.
To get detailed segments analysis, Request a Free Sample Report
As per the blood and blood components market regional forecast, North America is leading in a way that makes sense, due to a mix of advanced healthcare infrastructure, strict regulatory supervision and a noticeable level of clinical uptake. The United States as well as Canada have a concentration of top tier research entities, plus biotech businesses, which just helps product development, and not slowly. Their strong reimbursement structures and more or less mature supply chain systems also mean blood components keep showing up in hospitals without too many gaps. Public health organizations and private companies cooperating pushes safety norms forward, while donor recruitment efforts keep the blood supply reliable. All of that together basically locks in the region’s status as the “go to” reference point for quality, dependability, and tech progress in the global market.
United States Blood and Blood Components Market
The Blood and Blood Components sector in the United States gains momentum from plenty of research collaborations, major academic medical centers, and a regulatory setting that tends to allow quicker product approvals. There’s also a national focus on personalized medicine , which boosts adoption of advanced component treatments. At the same time, integrated donor management systems help keep collection volumes steady. With insurance coverage and reimbursement policies staying supportive, clinical use becomes broad, so the United States feels like a crucial node for both innovation and large scale distribution.
Canada Blood and Blood Components Market
The Canadian Blood and Blood Components Market outlook is shaped by a publicly financed healthcare system that puts safety and fair access near the top. Provincial health authorities and blood service organizations coordinate through networks that help streamline collection, testing, and delivery tasks. The emphasis leans into community based donor engagement, plus careful quality controls, which supports a consistent supply chain. Canada also backs research efforts aimed at better component preservation, so the country remains a stable but forward moving part of the regional scene.
Europe is expanding because of solid public health frameworks, coordinated regulatory harmonization, and cross border research teamwork. Nations like Germany, the United Kingdom, and France pour resources into translational studies, basically refining component therapies while improving how patients do. National blood services that are integrated help with systematic donor recruitment and high quality processing. Meanwhile policy moves encourage the adoption of next generation technologies. Also there’s an aging population plus growing needs for specialized transfusion services, so market activity keeps rising. EU wide standards, when they align well, improve both safety and efficiency, creating a lively growth atmosphere across the continent.
Germany Blood and Blood Components Market
The German Blood and Blood Components industry is often viewed as dominant, largely because the manufacturing base is strong, and quality standards are strict. The country has an extensive set of specialized blood centers, so donor management works efficiently and processing can stay high precision. Academic groups collaborating with industry also speeds up innovation, especially for component preservation and therapeutic uses. Government supported funding backs ongoing upgrades to safety protocols, strengthening Germany’s standing as a top tier market within Europe.
United Kingdom Blood and Blood Components Market
In the United Kingdom, the Blood and Blood Components Market is considered the fastest growing segment. This is tied to progressive healthcare changes, plus heavier investment into transfusion related research. The UK’s integrated national service supports streamlined donor recruitment, and it also supports advanced testing methodologies. Adoption of novel component technologies is pushed along by policy frameworks that feel supportive, plus active clinical trials. With patient centered care and robust regulatory oversight, confidence in the market improves and the sector expands quickly.
France Blood and Blood Components Market
France’s Blood and Blood Components Market is taking shape as a more active, dynamic contributor, supported by strategic public private arrangements and a strong interest in innovation. French blood agencies focus on donor outreach, then roll out cutting edge processing approaches to elevate component quality. Research institutions work closely with manufacturers to explore new therapeutic uses, while regulatory routes help new advances get into clinical practice sooner. This nurturing setup makes France an increasingly influential player across the European landscape.
Asia Pacific is pushing forward in its role, by expanding healthcare infrastructure then seeing a steady rise in clinical need, and also putting more weight on technology transfer. Countries like Japan and South Korea keep investing in sophisticated blood processing facilities, and they also lean into partnerships that help strengthen component safety and overall effectiveness. On top of that, government programs back up donor education, plus they require strict quality controls. Meanwhile the regional trade networks make it easier for know how to move around, so best practices get adopted faster, not just discussed. Put together, the growing patient requirements, the research ecosystems that are getting more innovative, and the steady policy backing, seems to drive the region in an upward direction, making it a key contributor to the global market.
Japan Blood and Blood Components Market
The Blood and Blood Components Market penetration in Japan is driven for advanced technology integration and a solid regulatory structure, which keeps quality levels high. Japan’s blood collection network is mature and it centers on donor protection, then efficient processing follows. At the same time, modern research laboratories focus on extending component shelf life, and that’s where a lot of quiet progress happens. Hospitals working alongside biotech organizations support the creation of specialized treatments, and that helps keep Japan among the leading markets in the region.
South Korea Blood and Blood Components Market
The Blood and Blood Components Market in South Korea is moving ahead with quick modernization of health services, plus government actions that actively promote donor involvement. State managed blood centers are using innovative testing approaches and preservation methods, which helps keep the supply chain dependable. Partnerships with universities and research institutes push studies toward newer component uses, while regulatory support helps speed up clinical take up. So overall, the blend of infrastructure upgrades and scientific attention strengthens South Korea’s standing across the Asia Pacific market.
To know more about the market opportunities by region and country, click here to
Buy The Complete Report
Increasing Surgical Interventions Demand
Advancements In Blood Component Technologies
Stringent Regulatory Compliance Requirements
Limited Donor Availability And Awareness
Request Free Customization of this report to help us to meet your business objectives.
The competitive landscape gets shaped by aggressive M&A deals, strategic alliances and tech‑led innovation, with companies going after plasma collection capacity and also advanced component processing. Grifols’ 2023 joint venture with China Biologic Products adds to its plasma‑derived portfolio across Asia, but Baxter’s 2022 partnership with the American Red Cross to roll out a digital blood‑inventory platform, pushes supply‑chain efficiency forward. That whole mix ends up making the rivalry among major global players feel even sharper.
Top Player’s Company Profile
Recent Developments in the Blood and Blood Components Market
SkyQuest’s ABIRAW (Advanced Business Intelligence, Research & Analysis Wing) is our Business Information Services team that Collects, Collates, Correlates, and Analyses the Data collected by means of Primary Exploratory Research backed by robust Secondary Desk research.
As per SkyQuest analysis, the global blood and blood components market is mainly pushed by the rising number of complex surgeries and trauma cases, which drives demand for transfusions that are safe, and readily available. At the same time advances in pathogen‑reduction, cold‑storage, and cryopreservation technologies keep accelerating growth by extending shelf life and enabling specialized therapies. Still, the market faces pressure from stringent regulatory compliance requirements, which add time and cost for new products and it can slow down scaling. North America stays dominant, mostly because of its advanced healthcare infrastructure and strong reimbursement frameworks. And the whole‑blood segment keeps leading, largely because it offers a complete, universal type of product that simplifies inventory management for hospitals, for them it’s easier.
| Report Metric | Details |
|---|---|
| Market size value in 2024 | USD 13.1 Billion |
| Market size value in 2033 | USD 17.7 Billion |
| Growth Rate | 3.4% |
| Base year | 2024 |
| Forecast period | (2026-2033) |
| Forecast Unit (Value) | USD Billion |
| Segments covered |
|
| Regions covered | North America (US, Canada), Europe (Germany, France, United Kingdom, Italy, Spain, Rest of Europe), Asia Pacific (China, India, Japan, Rest of Asia-Pacific), Latin America (Brazil, Rest of Latin America), Middle East & Africa (South Africa, GCC Countries, Rest of MEA) |
| Companies covered |
|
| Customization scope | Free report customization with purchase. Customization includes:-
|
To get a free trial access to our platform which is a one stop solution for all your data requirements for quicker decision making. This platform allows you to compare markets, competitors who are prominent in the market, and mega trends that are influencing the dynamics in the market. Also, get access to detailed SkyQuest exclusive matrix.
Table Of Content
Executive Summary
Market overview
Parent Market Analysis
Market overview
Market size
KEY MARKET INSIGHTS
COVID IMPACT
MARKET DYNAMICS & OUTLOOK
Market Size by Region
KEY COMPANY PROFILES
Methodology
For the Blood and Blood Components Market, our research methodology involved a mixture of primary and secondary data sources. Key steps involved in the research process are listed below:
1. Information Procurement: This stage involved the procurement of Market data or related information via primary and secondary sources. The various secondary sources used included various company websites, annual reports, trade databases, and paid databases such as Hoover's, Bloomberg Business, Factiva, and Avention. Our team did 45 primary interactions Globally which included several stakeholders such as manufacturers, customers, key opinion leaders, etc. Overall, information procurement was one of the most extensive stages in our research process.
2. Information Analysis: This step involved triangulation of data through bottom-up and top-down approaches to estimate and validate the total size and future estimate of the Blood and Blood Components Market.
3. Report Formulation: The final step entailed the placement of data points in appropriate Market spaces in an attempt to deduce viable conclusions.
4. Validation & Publishing: Validation is the most important step in the process. Validation & re-validation via an intricately designed process helped us finalize data points to be used for final calculations. The final Market estimates and forecasts were then aligned and sent to our panel of industry experts for validation of data. Once the validation was done the report was sent to our Quality Assurance team to ensure adherence to style guides, consistency & design.
Analyst Support
Customization Options
With the given market data, our dedicated team of analysts can offer you the following customization options are available for the Blood and Blood Components Market:
Product Analysis: Product matrix, which offers a detailed comparison of the product portfolio of companies.
Regional Analysis: Further analysis of the Blood and Blood Components Market for additional countries.
Competitive Analysis: Detailed analysis and profiling of additional Market players & comparative analysis of competitive products.
Go to Market Strategy: Find the high-growth channels to invest your marketing efforts and increase your customer base.
Innovation Mapping: Identify racial solutions and innovation, connected to deep ecosystems of innovators, start-ups, academics, and strategic partners.
Category Intelligence: Customized intelligence that is relevant to their supply Markets will enable them to make smarter sourcing decisions and improve their category management.
Public Company Transcript Analysis: To improve the investment performance by generating new alpha and making better-informed decisions.
Social Media Listening: To analyze the conversations and trends happening not just around your brand, but around your industry as a whole, and use those insights to make better Marketing decisions.
REQUEST FOR SAMPLE
 REQUEST FREE CUSTOMIZATION
Global Blood And Blood Components Market size was valued at USD 13.1 Billion in 2024 and is poised to grow from USD 13.55 Billion in 2025 to USD 17.7 Billion by 2033, growing at a CAGR of 3.4% during the forecast period (2026-2033).
The competitive landscape is shaped by aggressive M&A, strategic partnerships and technology‑driven innovation, with firms vying for plasma collection capacity and advanced component processing. Grifols’ 2023 joint venture with China Biologic Products expands its plasma‑derived portfolio in Asia, while Baxter’s 2022 partnership with the American Red Cross to launch a digital blood‑inventory platform accelerates supply‑chain efficiency, intensifying rivalry among global leaders. 'Grifols', 'CSL Behring', 'Takeda Pharmaceutical', 'Octapharma', 'Kedrion Biopharma', 'Baxter International', 'Fresenius Kabi', 'Bio Products Laboratory', 'LFB Group', 'China Biologic Products', 'Japan Blood Products Organization', 'Sanquin', 'Kawasumi Laboratories', 'Macopharma', 'Terumo Corporation', 'Haemonetics Corporation', 'Immucor', 'Cerus Corporation', 'Ortho Clinical Diagnostics', 'Abbott Laboratories'
Rising numbers of complex surgeries and trauma cases are elevating the need for safe and readily available blood products, prompting hospitals to expand their transfusion services and invest in modern inventory systems, thereby stimulating demand across the supply chain and encouraging manufacturers to broaden production capacities to meet clinical requirements. This trend is further reinforced by expanding healthcare infrastructure in emerging economies, where increased access to surgical care drives additional volume, and by clinicians’ preference for component-specific therapies that enhance patient outcomes, collectively reinforcing market expansion.
Advanced Pathogen Inactivation: The industry is rapidly adopting next‑generation pathogen reduction technologies that treat whole blood, platelets, and plasma to neutralize viruses, bacteria, and parasites without compromising functionality. These solutions enhance transfusion safety, reduce reliance on donor screening, and enable longer storage windows, which is especially valuable for remote and low‑resource hospitals. As hospitals prioritize risk mitigation, manufacturers are expanding portfolios with photochemical, solvent‑detergent, and nanofiltration platforms, driving stronger supplier‑client collaborations and reshaping procurement strategies across the value chain.
Why does North America Dominate the Global Blood and Blood Components Market? |@12


Want to customize this report? This report can be personalized according to your needs. Our analysts and industry experts will work directly with you to understand your requirements and provide you with customized data in a short amount of time. We offer $1000 worth of FREE customization at the time of purchase.
Feedback From Our Clients


 USA (+1) 351-333-4748

