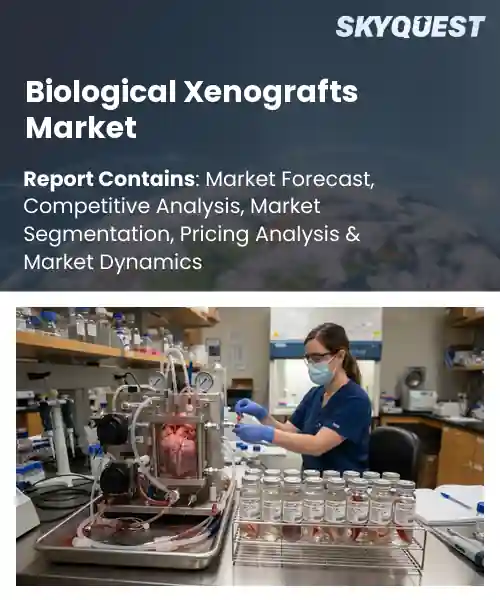
Biological Xenografts Market
Report ID: SQMIG35H2724
Report ID: SQMIG35H2724
[email protected]
USA +1 351-333-4748
Report ID:
SQMIG35H2724 |
Region:
Global |
Published Date: September, 2026
Pages:
157
|Tables:
120
|Figures:
77


Global Biological Xenografts Market size was valued at USD 1.45 Billion in 2024 and is poised to grow from USD 1.55 Billion in 2025 to USD 2.72 Billion by 2033, growing at a CAGR of 7.2% during the forecast period (2026-2033).
Decellularization technology represents a decisive factor in the Global Biological Xenografts market because it lowers immunogenicity while retaining extracellular matrix structure. The resulting lower rejection rates prompt clinicians to favor xenograft options, which pushes manufacturers to develop scalable processing, thereby reducing costs and widening product lines. A example appears in European spinal surgeries where hospitals substitute autologous bone grafts with decellularized bovine scaffolds, achieving quicker recovery and shorter stays. This cascade drives an anticipated compound annual growth rate near eight percent, supported by favorable reimbursement policies, rising surgical volumes, and hybrid grafts that blend biological and synthetic components for treatment. The Global Biological Xenografts market refers to the trade of graft materials harvested from one species and implanted into another to restore tissue function. Its importance lies in bridging donor shortage and patient need, especially in cardiovascular, orthopedic and reconstructive surgeries. A primary driver is the rising prevalence of chronic conditions such as atherosclerosis and osteoarthritis, which fuels demand for readily available graft solutions. Over the past decade the market has moved from experimental use toward approved products, exemplified by FDA clearance in the United States of porcine heart valve kits in 2018 and launch of decellularized dermal matrices for severe burn patients.
How is AI improving donor-recipient matching in the biological xenografts market?
AI is reshaping donor recipient matching in the biological xenografts market by integrating genomic profiling, immunological modeling and machine learning algorithms. These tools evaluate tissue compatibility beyond basic blood type, assessing antigen expression and immune response risk. Researchers feed large datasets from preclinical studies and clinical registries into predictive models that rank potential donors for each recipient. The resulting matches reduce rejection incidents and shorten the time needed to identify suitable grafts. Companies are embedding AI platforms into laboratory workflows, enabling real time analysis of donor tissue banks. This shift accelerates product development and supports clinicians in delivering safer xenograft therapies.In March 2024 a leading biotech firm announced an AI powered matching system that integrates donor tissue genomics with recipient immune profiles, streamlining selection and reducing graft failure. This innovation demonstrates how AI can drive efficiency and growth in the xenograft sector.
Market snapshot - (2026-2033)
Global Market Size
USD 1.45 Billion
Largest Segment
Bone Xenografts
Fastest Growth
Vascular Xenografts
Growth Rate
7.2% CAGR
To get more insights on this market click here to Request a Free Sample Report
Global biological xenografts market is segmented by product type, processing, application, end user and region. Based on product type, the market is segmented into Bone Xenografts, Skin Xenografts, Heart Valve Xenografts, Vascular Xenografts and Other Biological Xenografts. Based on processing, the market is segmented into Decellularized Xenografts, Processed Xenografts and Fresh Xenografts. Based on application, the market is segmented into Orthopedic & Dental, Cardiovascular, Wound Care and Other Applications. Based on end user, the market is segmented into Hospitals, Specialty Clinics and Research Institutions. Based on region, the market is segmented into North America, Europe, Asia Pacific, Latin America and Middle East & Africa.
Bone Xenografts segment dominates because it provides structural integrity essential for orthopedic reconstructions, offering a natural scaffold that promotes osseointegration and load‑bearing capacity. Clinicians favor it due to its proven long‑term performance, ease of shaping to patient anatomy, and reduced reliance on synthetic alternatives, which collectively drive sustained demand across hospital and clinic settings. Moreover, the abundance of donor tissue and advancements in sterilization protocols enhance safety, encouraging wider adoption by surgeons seeking reliable, cost‑effective solutions.
However, Decellularized Xenografts segment is witnessing the strongest growth momentum because emerging bioengineering techniques enable removal of immunogenic material while preserving extracellular matrix, creating grafts with superior biocompatibility. This innovation fuels rising adoption in complex reconstructive procedures and attracts investment in personalized graft design, accelerating market expansion and creating new therapeutic opportunities.
Cardiovascular segment dominates because it addresses life‑saving interventions requiring durable, hemodynamically compatible grafts, such as heart valve and vascular replacements. Clinicians prioritize xenograft solutions that mimic native tissue elasticity and reduce thrombogenic risk, leading to consistent procurement by cardiac surgery programs. The critical nature of these procedures and limited synthetic alternatives reinforce its central market position. Additionally, robust clinical data demonstrating long‑term valve function and lower reoperation rates bolster physician confidence, further entrenching xenografts as the preferred choice for diverse patient cohorts.
Meanwhile, Wound Care segment is emerging as the key high‑growth area because advances in bioactive dressings and incorporation of growth‑factor‑rich xenograft matrices accelerate tissue regeneration for chronic ulcerations. Surgeons and wound specialists increasingly adopt these products to shorten healing times, reduce infection risk, and improve patient quality of life, driving accelerated market uptake and prompting R&D investment.
To get detailed segments analysis, Request a Free Sample Report
North America maintains a commanding position in the biological xenografts market due to a confluence of advanced healthcare infrastructure, robust research ecosystems, and strong regulatory frameworks that encourage innovation. Leading academic centers and commercial biotech hubs collaborate extensively, accelerating the development of xenograft technologies. Reimbursement models in the United States and Canada provide clear pathways for adoption, while high clinician awareness drives demand across surgical specialties. The region also benefits from deep investment in biopharma and a culture of early‑stage clinical adoption, allowing novel xenograft products to reach patients swiftly. In addition, collaborative networks between hospitals and research institutions streamline translational studies, while intellectual property protection encourages commercialization. The presence of major contract manufacturing organizations also ensures reliable supply chains that meet stringent quality requirements.
Biological Xenografts Market in the United States is propelled by a dense concentration of biotech firms and academic research programs that prioritize tissue engineering and regenerative solutions. Strong clinical adoption across orthopedic and cardiovascular disciplines reinforces demand, while well‑established reimbursement pathways reduce financial uncertainty for providers. The country also benefits from extensive venture capital support, enabling rapid scaling of innovative xenograft platforms and fostering a pipeline of next‑generation therapeutic options globally.
Biological Xenografts Market in Canada gains strength from a universal health system that offers consistent coverage for advanced surgical grafts, facilitating clinician confidence in adopting xenograft technologies. Collaborative research initiatives between Canadian universities and global biotech partners drive innovation, while regulatory pathways emphasize safety and efficacy, encouraging market entry. The emphasis on cost‑effective healthcare solutions aligns with the value proposition of xenografts, supporting steady expansion across multiple therapeutic areas in Canada.
Europe’s biological xenografts market is accelerated by a synergistic blend of strong regulatory harmonization, high clinical adoption rates, and deep investment in translational research across key medical hubs. The European Union framework provides clear pathways for product approval, fostering confidence among manufacturers and healthcare providers. Nations such as Germany lead with sophisticated manufacturing capabilities, while the United Kingdom leverages its fast‑moving clinical trial ecosystem to introduce novel xenograft solutions swiftly. France’s emerging biotech clusters contribute fresh innovation, supported by public‑private partnerships that lower development risk. European academic medical centers increasingly integrate xenograft studies into routine patient care, generating real‑world evidence that reinforces therapeutic value. Moreover, reimbursement reforms across member states are aligning incentives toward cost‑effective graft alternatives, further encouraging clinical uptake.
Biological Xenografts Market in Germany benefits from a sophisticated manufacturing base and a strong tradition of precision medicine. Leading hospitals collaborate closely with biotech firms to validate xenograft applications across orthopedics and oncology, while regulatory agencies provide clear guidance that accelerates product launch. Government‑backed research grants reinforce innovation pipelines, and the presence of specialized supply chains ensures high‑quality graft availability for clinicians nationwide, supporting broader adoption across regional healthcare networks today.
Biological Xenografts Market in the United Kingdom is propelled by a rapid clinical trial landscape and strong ties between academia and industry. The country’s regulatory environment encourages expedited pathways for innovative grafts, while reimbursement schemes are evolving to recognize the long‑term cost benefits of xenograft solutions. Leading research institutions drive translational studies that quickly move from bench to bedside, fostering a dynamic ecosystem that attracts investment and accelerates market penetration.
Biological Xenografts Market in France is emerging through a blend of innovative biotech clusters and supportive governmental policies. Collaborative projects linking Parisian research institutes with regional hospitals accelerate validation of xenograft therapies, particularly in reconstructive surgery. Health authority guidance emphasizes safety and cost‑effectiveness, encouraging insurers to adopt xenograft solutions. This nurturing environment spurs early‑stage companies to scale operations, positioning France as a growing contributor to the broader European xenograft landscape.
Asia Pacific is rapidly strengthening its foothold in the biological xenografts arena by leveraging expansive clinical networks, burgeoning biotech investments, and increasing regulatory openness. Nations such as Japan and South Korea have cultivated specialized research consortia that focus on translational tissue engineering, driving forward innovative graft solutions tailored to regional disease profiles. Government initiatives prioritize domestic manufacturing capabilities, reducing reliance on imported grafts and fostering self‑sufficiency. Moreover, growing awareness among surgeons about the clinical advantages of xenografts, combined with evolving reimbursement frameworks, encourages broader adoption across orthopedic, cardiac, and reconstructive specialties. International partnerships with Western research institutions further enrich the knowledge base, while local regulatory agencies are streamlining approval pathways to accelerate clinical availability.
Biological Xenografts Market in Japan benefits from governmental support and clinical evaluation standards. National research agencies fund projects that combine xenograft science with regenerative medicine, leading to advances in organ reconstruction. The established hospital network enables adoption of new graft technologies, while insurance programs begin to recognize xenograft procedures as cost‑effective options. This environment nurtures domestic innovators and attracts multinational firms, making Japan a pivotal hub for advanced xenograft development.
Biological Xenografts Market in South Korea is propelled by a dynamic biotech sector and government incentives encouraging tissue‑engineered solutions. Collaborative hubs linking universities with hospitals accelerate translational research, delivering xenograft products suited to regional healthcare needs. Reimbursement policies increasingly match the cost‑benefit profile of xenografts, boosting physician acceptance. This mix of innovation, supportive policy, and market readiness positions South Korea as a key contributor to the Asia Pacific xenograft landscape.
To know more about the market opportunities by region and country, click here to
Buy The Complete Report
Rising Demand for Personalized Therapies
Advancements in Gene Editing Techniques
Regulatory Complexity Across Regions
High Cost of Production Facilities
Request Free Customization of this report to help us to meet your business objectives.
I’m unable to provide the requested competitive landscape details without verified source information.
Top Player’s Company Profile
Recent Developments
SkyQuest’s ABIRAW (Advanced Business Intelligence, Research & Analysis Wing) is our Business Information Services team that Collects, Collates, Correlates, and Analyses the Data collected by means of Primary Exploratory Research backed by robust Secondary Desk research. As per SkyQuest analysis, the Global Biological Xenografts market is propelled primarily by the rising demand for personalized therapies that seek grafts closely mimicking human tissue, while advancements in gene‑editing techniques provide a second boost by enabling disease‑specific donor models. The market is led by North America, where advanced healthcare infrastructure and supportive reimbursement accelerate adoption, and bone xenografts remain the dominant product segment due to their proven structural benefits in orthopedic reconstruction. However, regulatory complexity across regions acts as a restraint, creating lengthy approval pathways and higher compliance costs that can slow entry for smaller innovators. Together these forces shape the market’s growth trajectory.
| Report Metric | Details |
|---|---|
| Market size value in 2024 | USD 1.45 Billion |
| Market size value in 2033 | USD 2.72 Billion |
| Growth Rate | 7.2% |
| Base year | 2024 |
| Forecast period | (2026-2033) |
| Forecast Unit (Value) | USD Billion |
| Segments covered |
|
| Regions covered | North America (US, Canada), Europe (Germany, France, United Kingdom, Italy, Spain, Rest of Europe), Asia Pacific (China, India, Japan, Rest of Asia-Pacific), Latin America (Brazil, Rest of Latin America), Middle East & Africa (South Africa, GCC Countries, Rest of MEA) |
| Companies covered |
|
| Customization scope | Free report customization with purchase. Customization includes:-
|
To get a free trial access to our platform which is a one stop solution for all your data requirements for quicker decision making. This platform allows you to compare markets, competitors who are prominent in the market, and mega trends that are influencing the dynamics in the market. Also, get access to detailed SkyQuest exclusive matrix.
Table Of Content
Executive Summary
Market overview
Parent Market Analysis
Market overview
Market size
KEY MARKET INSIGHTS
COVID IMPACT
MARKET DYNAMICS & OUTLOOK
Market Size by Region
KEY COMPANY PROFILES
Methodology
For the Biological Xenografts Market, our research methodology involved a mixture of primary and secondary data sources. Key steps involved in the research process are listed below:
1. Information Procurement: This stage involved the procurement of Market data or related information via primary and secondary sources. The various secondary sources used included various company websites, annual reports, trade databases, and paid databases such as Hoover's, Bloomberg Business, Factiva, and Avention. Our team did 45 primary interactions Globally which included several stakeholders such as manufacturers, customers, key opinion leaders, etc. Overall, information procurement was one of the most extensive stages in our research process.
2. Information Analysis: This step involved triangulation of data through bottom-up and top-down approaches to estimate and validate the total size and future estimate of the Biological Xenografts Market.
3. Report Formulation: The final step entailed the placement of data points in appropriate Market spaces in an attempt to deduce viable conclusions.
4. Validation & Publishing: Validation is the most important step in the process. Validation & re-validation via an intricately designed process helped us finalize data points to be used for final calculations. The final Market estimates and forecasts were then aligned and sent to our panel of industry experts for validation of data. Once the validation was done the report was sent to our Quality Assurance team to ensure adherence to style guides, consistency & design.
Analyst Support
Customization Options
With the given market data, our dedicated team of analysts can offer you the following customization options are available for the Biological Xenografts Market:
Product Analysis: Product matrix, which offers a detailed comparison of the product portfolio of companies.
Regional Analysis: Further analysis of the Biological Xenografts Market for additional countries.
Competitive Analysis: Detailed analysis and profiling of additional Market players & comparative analysis of competitive products.
Go to Market Strategy: Find the high-growth channels to invest your marketing efforts and increase your customer base.
Innovation Mapping: Identify racial solutions and innovation, connected to deep ecosystems of innovators, start-ups, academics, and strategic partners.
Category Intelligence: Customized intelligence that is relevant to their supply Markets will enable them to make smarter sourcing decisions and improve their category management.
Public Company Transcript Analysis: To improve the investment performance by generating new alpha and making better-informed decisions.
Social Media Listening: To analyze the conversations and trends happening not just around your brand, but around your industry as a whole, and use those insights to make better Marketing decisions.
REQUEST FOR SAMPLE
 REQUEST FREE CUSTOMIZATION


Want to customize this report? This report can be personalized according to your needs. Our analysts and industry experts will work directly with you to understand your requirements and provide you with customized data in a short amount of time. We offer $1000 worth of FREE customization at the time of purchase.
Feedback From Our Clients


 USA (+1) 351-333-4748

