Bioenergy Market Size, Share, and Growth Analysis

Global Bioenergy Market

Bioenergy Market By Product Type (Solid Biomass, Liquid Biofuel), By Feedstock (Agricultural Waste, Wood Waste), By Technology (Gasification, Fast Pyrolysis), By Application, By Region - Industry Forecast 2025-2032


Report ID: SQMIG55F2066 | Region: Global | Published Date: January, 2025
Pages: 190 |Tables: 93 |Figures: 71

Format - word format excel data power point presentation

Bioenergy Market Insights

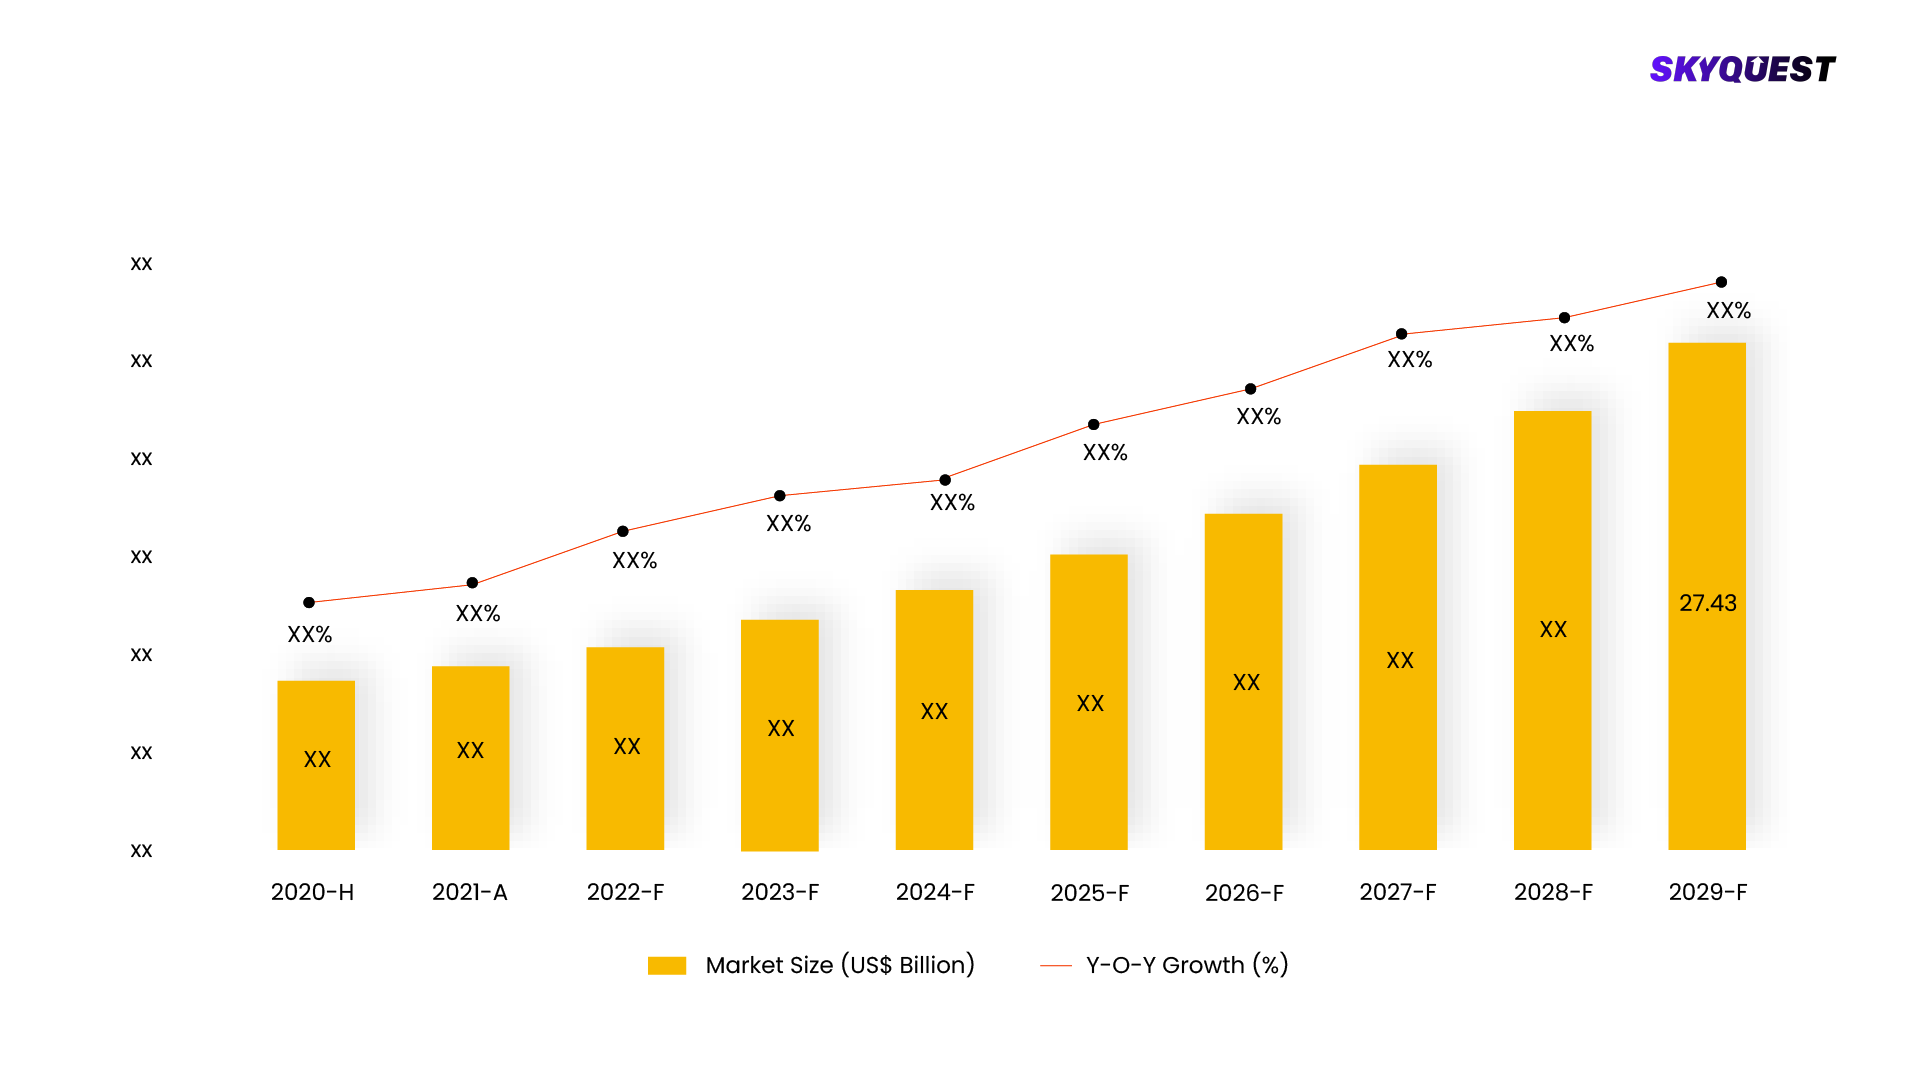
Global Bioenergy Market size was valued at USD 128.5 billion in 2023 and is poised to grow from USD 139.17 billion in 2024 to USD 263.37 billion by 2032, growing at a CAGR of 8.3% during the forecast period (2025-2032). 

The growing demand for renewable alternatives to fossil fuels and the increased global focus on sustainable energy sources have been driving major trends in the bioenergy industry in recent years. The move to biofuels as a greener and cleaner alternative to petrol for vehicles is one such development. Most typically biofuels are produced using hardwoods. Just like biodiesel, ethanol is obtaining acceptance worldwide in places such as America and Europe. America is currently using around 69% of ethanol from some sources which has resulted in increased concerns for alternative fuels and sources-from which biodiesel such as soybeans, corn, and sugarcane are produced. Regulation pushing the development of advanced biofuels and renewable fuels has turned to a positive perspective.

Another developing trend in bioenergy, which has been increasingly receiving interest in the global bioenergy market is biomass power generation. Biomass is defined as the organic resources used to generate electricity through combustion, gasification, or anaerobic digestion, including wood, agricultural waste, and municipal solid waste. Such a resource is becoming increasingly popular with countries trying to diversify energy portfolios and reduce their dependence on fossil fuels. In addition, through production of energy from organic waste streams, biomass power plants will help solve waste management problems and offer renewable energy-based solutions to environmental and energy concerns.

Market snapshot - 2025-2032

Global Market Size

USD 128.5 billion

Largest Segment

Liquid Biofuel

Fastest Growth

Solid Biomass

Growth Rate

8.3% CAGR

Global Bioenergy Market ($ Bn)
Country Share by Europe (%)

To get more reports on the above market click here to Buy The Report

Bioenergy Market Segments Analysis

Global Bioenergy Market is segmented by Product Type, Feedstock, Technology, Application and region. Based on Product Type, the market is segmented into Solid Biomass, Liquid Biofuel, Biogas and Others. Based on Feedstock, the market is segmented into Agricultural Waste, Wood Waste, Solid Waste and Others. Based on Technology, the market is segmented into Gasification, Fast Pyrolysis, Fermentation and Other Technologies. Based on Application, the market is segmented into Power Generation, Heat Generation, Transportation and Others. Based on region, the market is segmented into North America, Europe, Asia Pacific, Latin America and Middle East & Africa.  

Analysis by Product Type

As per categorization by product type, the market is classified as solid biomass, liquid biofuel, biogas, and others. Among these, liquid biofuel earned the largest share and continues to hold the dominant global bioenergy market share. Liquid biofuels, such as ethanol and biodiesel, are driving innovation in the global bioenergy market due to their sustainable, renewable nature and ability to reduce greenhouse gas emissions. With advancements in production technologies, like second and third-generation biofuels, efficiency has increased. This is due to current infrastructural designs-such as internal combustion engines-for an ideal solution to different transportation sectors that want to lessen carbon footprint and dependency on fossil fuels.

Solid biomass is poised to be the fastest-growing segment in the global bioenergy market due to its versatile applications and abundant availability. In an attempt to meet the decarbonization goals, the industries and power plants increasingly turn to alternative sources of renewable energy. Solid biomass includes woody biomass such as wood pellets or agricultural residues, which are inexpensive and sustainable at the same time. Besides, replacing coal in power generation and heat production with improved technologies enables efficiency improvement and emissions reductions, creating a growth environment for market. Again, solid biomass is viewed as one of the new players in the rural economy, where it creates employment opportunities as well as aims towards energy independence, thus stimulating its market growth.

Analysis by Feedstock

Solid waste is gaining significant traction in the global bioenergy market due to its potential as a sustainable feedstock for energy production. Innovative advances in waste-to-energy (WTE) technologies have made advanced anaerobic digestion and gasification techniques nowadays very efficient in producing electricity, heat, and biofuels from both municipal or industrial waste. The main reason why this current bioenergy source dominates is due to its great availability, particularly in urban regions, while at the same time decreasing landfill disposal and thus increasing renewable energy production. In terms of the energy itself, governments now advocate for waste management and environmental sustainability as solid waste bioenergy solutions have a very sustainable and realistic circular economy model that is gaining adoption worldwide.

Agricultural waste is set to become the fastest-growing segment in the global bioenergy market due to its vast availability and potential for energy production. All farming leftovers such as crop stalks, husks, and manure are converted into biofuels, biogas, and bioelectricity using the amount of new innovative technology available like anaerobic digestion and pyrolysis through meeting the increased demand for sustainable energy. The expansion has mainly been fueled by the need for waste minimization, greenhouse gas emission reductions, and energy security improvements, especially in rural regions. Besides, agricultural waste is a renewable and cost-effective energy alternative; hence, it is one of the most important sources for the transition to a new, sustainable energy future.

Global Bioenergy Market By Product Type (%)

To get detailed analysis on other segments, Request For Free Sample Report

Bioenergy Market Regional Insights

Europe is dominating the global bioenergy market due to strong policy support, ambitious renewable energy targets, and extensive infrastructure for bioenergy production and distribution. The European Union commits to reduce greenhouse gas emissions levels and attaining carbon neutrality by 2050, which in turn induces investments in sustainable bioenergy solutions such as biomass, biogas, and biofuels. In this regard, there are well-functioning waste management systems and agriculture practices in Europe and that provides an abundance of inputs for the feedstock necessary in bioenergy production. Government incentives like subsidization and renewable energy mandates together with technology breakthroughs consolidated Europe's leadership in the global bioenergy market outlook, thus compounding growth and spreading bioenergy throughout Europe.

North America is the fastest-growing region in the global bioenergy market, driven by increasing demand for sustainable energy solutions and supportive government policies. Encouragement in establishing new ambitious targets for renewable energy has stimulated, in both the United States and Canada, investment in bioenergy technologies such as advanced biofuels, biogas, and biomass. The region's thriving agricultural and forestry sectors provide much feedstock for bioenergy production. In addition, new advances in waste-to-energy technologies and improved agricultural practices add to such growth. North America's emphasis on energy security, low-carbon economies, and diversification to cleaner energy sources adds rapidly to the significance of this region as a emerging region in the global bioenergy market.

Global Bioenergy Market By Geography
  • Largest
  • Fastest

To know more about the market opportunities by region and country, click here to
Buy The Complete Report

Bioenergy Market Dynamics

Drivers

Government Policies and Regulations

  • Policies and regulations are fundamental driving factors of the global bioenergy market; nations across the globe are developing ambitious renewable energy targets and establishing laws for subsidies, tax incentives, and mandates for bioenergy consumption. Such supportive policies fuel investments in bioenergy technologies and speed up transition to cleaner energy sources, all things being equal.

Technological Advancements in Biofuel Production

  • Driving the global bioenergy market growth are the various technological advancements. Novel technologies provide advancements in innovative biofuel production, converting waste to energy systems, and biogas, which improve efficiency and cost-effectiveness. These processes for improved conversions, such as advanced fermentation and gasification, have widened the scales of biomass feedstocks that may be considered, thus making bioenergy a viable and truly scalable solution.

Restraints

Environmental and Land Use Concerns

  • Environmental and land use concerns present challenges for the global bioenergy market. Deforestation, loss of biodiversity, and competition for land with food production are all effects of large-scale bioenergy production. Furthermore, issues regarding the greenhouse gas emissions released from biofuel production processes limit its perceived sustainability, and this affects public perception and market growth.

Technological Limitations in Bioenergy Production

  • Recognizing the progress they have made, bioenergy technologies continue to suffer certain limitations, namely, the inadequacies in converting biomass to usable energy. Low conversion rates, high-energy inputs for process production, and other critical scaling problems have made bioenergy technologies non-competitive as compared with fossil fuels. These technological hurdles must be overcome to delay the broader adoption and marketing of bioenergy.

Request Free Customization of this report to help us to meet your business objectives.

Bioenergy Market Competitive Landscape

With intense competition across the global bioenergy market, the major players in this industry are involving themselves in innovating and pushing for bioenergy technology advancements and make it more sustainable solutions. Siemens AG, Neste Corporation, Enel Green Power, and Drax Group are a few major players operating in the bioenergy production, renewable energy solutions, and biomass power sectors. They make about including advanced biofuels and biogas technologies within their contingent systems waste-to-energy in enhancing their market shares in global sustainability and government mandates on reducing carbon emissions.

Top Players in Bioenergy Market

  • Drax Group (UK) 
  • Enviva Inc. (USA) 
  • Neste Corporation (Finland) 
  • Renewi plc (UK) 
  • VERBIO Vereinigte BioEnergie AG (Germany) 
  • Valmet Oyj (Finland) 
  • REG (Renewable Energy Group) (USA) 
  • ADM (Archer Daniels Midland) (USA) 
  • Bunge Limited (USA) 
  • Wilmar International (Singapore) 
  • Eni S.p.A. (Italy) 
  • Raizen S.A. (Brazil) 
  • Abengoa S.A. (Spain) 
  • Clariant AG (Switzerland) 
  • Novozymes A/S (Denmark) 
  • POET, LLC (USA) 
  • Green Plains Inc. (USA) 
  • Cosan S.A. (Brazil) 
  • Metsa Group (Finland)

Recent Developments

  • In October 2024, Neste Corporation, a leading producer of renewable diesel, announced the expansion of its biofuels production capacity in Europe. The new facility in Rotterdam aims to increase the supply of renewable fuels to meet rising demand for sustainable transportation solutions, enhancing the company’s carbon-neutral commitment.
  • In September 2024, Drax Group completed the development of a new biomass pellet production facility in the United States. The facility is expected to produce millions of tons of sustainable biomass pellets annually, supporting Drax’s goal to reduce carbon emissions by using renewable energy to replace coal in power generation.
  • In July 2024, The Renewable Energy Group created a partnership with one of the best oil companies for the purpose of adding more renewable diesel into their fuel portfolio. This wants to capture biofuels perfectly in the efforts of decarbonizing the transportation industry and solidifying REG's leadership in the market at the same time.

Bioenergy Key Market Trends

Bioenergy Market SkyQuest Analysis

SkyQuest's ABIRAW (Advanced Business Intelligence, Research & Analysis Wing) is our Business Information Services team that Collects, Collates, Correlates, and Analyses the Data collected by means of Primary Exploratory Research backed by robust Secondary Desk research.

As per SkyQuest analysis, the global bioenergy industry is experiencing rapid growth due to increased demand for sustainable energy solutions and innovations in biofuel production technologies. Government policies and improvements in technology are crucial to the future of this market with regard to the adoption of cleaner energy alternatives, including biofuels, biomass, and converted waste-to-energy applications.

Regional powerhouses, Europe and North America in particular boost bioenergy more. However, some challenges remain such as land-use-related issues and technology limitations, which may prove to become impediments. Development and investment still continue; thus, it is anticipated for bioenergy to feature strongly in the transition into a sustainable energy future.

Report Metric Details
Market size value in 2023 USD 128.5 billion
Market size value in 2032 USD 263.37 billion
Growth Rate 8.3%
Base year 2024
Forecast period 2025-2032
Forecast Unit (Value) USD Billion
Segments covered
  • Product Type
    • Solid Biomass
    • Liquid Biofuel
    • Biogas
    • Others
  • Feedstock
    • Agricultural Waste
    • Wood Waste
    • Solid Waste
    • Others
  • Technology
    • Gasification
    • Fast Pyrolysis
    • Fermentation
    • Other Technologies
  • Application
    • Power Generation
    • Heat Generation
    • Transportation
    • Others
Regions covered North America (US, Canada), Europe (Germany, France, United Kingdom, Italy, Spain, Rest of Europe), Asia Pacific (China, India, Japan, Rest of Asia-Pacific), Latin America (Brazil, Rest of Latin America), Middle East & Africa (South Africa, GCC Countries, Rest of MEA)
Companies covered
  • Drax Group (UK) 
  • Enviva Inc. (USA) 
  • Neste Corporation (Finland) 
  • Renewi plc (UK) 
  • VERBIO Vereinigte BioEnergie AG (Germany) 
  • Valmet Oyj (Finland) 
  • REG (Renewable Energy Group) (USA) 
  • ADM (Archer Daniels Midland) (USA) 
  • Bunge Limited (USA) 
  • Wilmar International (Singapore) 
  • Eni S.p.A. (Italy) 
  • Raizen S.A. (Brazil) 
  • Abengoa S.A. (Spain) 
  • Clariant AG (Switzerland) 
  • Novozymes A/S (Denmark) 
  • POET, LLC (USA) 
  • Green Plains Inc. (USA) 
  • Cosan S.A. (Brazil) 
  • Metsa Group (Finland)
Customization scope

Free report customization with purchase. Customization includes:-

  • Segments by type, application, etc
  • Company profile
  • Market dynamics & outlook
  • Region

To get a free trial access to our platform which is a one stop solution for all your data requirements for quicker decision making. This platform allows you to compare markets, competitors who are prominent in the market, and mega trends that are influencing the dynamics in the market. Also, get access to detailed SkyQuest exclusive matrix.

Buy The Complete Report to read the analyzed strategies adopted by the top vendors either to retain or gain market share

Table Of Content

Executive Summary

Market overview

  • Exhibit: Executive Summary – Chart on Market Overview
  • Exhibit: Executive Summary – Data Table on Market Overview
  • Exhibit: Executive Summary – Chart on Bioenergy Market Characteristics
  • Exhibit: Executive Summary – Chart on Market by Geography
  • Exhibit: Executive Summary – Chart on Market Segmentation
  • Exhibit: Executive Summary – Chart on Incremental Growth
  • Exhibit: Executive Summary – Data Table on Incremental Growth
  • Exhibit: Executive Summary – Chart on Vendor Market Positioning

Parent Market Analysis

Market overview

Market size

  • Market Dynamics
    • Exhibit: Impact analysis of DROC, 2021
      • Drivers
      • Opportunities
      • Restraints
      • Challenges
  • SWOT Analysis

KEY MARKET INSIGHTS

  • Technology Analysis
    • (Exhibit: Data Table: Name of technology and details)
  • Pricing Analysis
    • (Exhibit: Data Table: Name of technology and pricing details)
  • Supply Chain Analysis
    • (Exhibit: Detailed Supply Chain Presentation)
  • Value Chain Analysis
    • (Exhibit: Detailed Value Chain Presentation)
  • Ecosystem Of the Market
    • Exhibit: Parent Market Ecosystem Market Analysis
    • Exhibit: Market Characteristics of Parent Market
  • IP Analysis
    • (Exhibit: Data Table: Name of product/technology, patents filed, inventor/company name, acquiring firm)
  • Trade Analysis
    • (Exhibit: Data Table: Import and Export data details)
  • Startup Analysis
    • (Exhibit: Data Table: Emerging startups details)
  • Raw Material Analysis
    • (Exhibit: Data Table: Mapping of key raw materials)
  • Innovation Matrix
    • (Exhibit: Positioning Matrix: Mapping of new and existing technologies)
  • Pipeline product Analysis
    • (Exhibit: Data Table: Name of companies and pipeline products, regional mapping)
  • Macroeconomic Indicators

COVID IMPACT

  • Introduction
  • Impact On Economy—scenario Assessment
    • Exhibit: Data on GDP - Year-over-year growth 2016-2022 (%)
  • Revised Market Size
    • Exhibit: Data Table on Bioenergy Market size and forecast 2021-2027 ($ million)
  • Impact Of COVID On Key Segments
    • Exhibit: Data Table on Segment Market size and forecast 2021-2027 ($ million)
  • COVID Strategies By Company
    • Exhibit: Analysis on key strategies adopted by companies

MARKET DYNAMICS & OUTLOOK

  • Market Dynamics
    • Exhibit: Impact analysis of DROC, 2021
      • Drivers
      • Opportunities
      • Restraints
      • Challenges
  • Regulatory Landscape
    • Exhibit: Data Table on regulation from different region
  • SWOT Analysis
  • Porters Analysis
    • Competitive rivalry
      • Exhibit: Competitive rivalry Impact of key factors, 2021
    • Threat of substitute products
      • Exhibit: Threat of Substitute Products Impact of key factors, 2021
    • Bargaining power of buyers
      • Exhibit: buyers bargaining power Impact of key factors, 2021
    • Threat of new entrants
      • Exhibit: Threat of new entrants Impact of key factors, 2021
    • Bargaining power of suppliers
      • Exhibit: Threat of suppliers bargaining power Impact of key factors, 2021
  • Skyquest special insights on future disruptions
    • Political Impact
    • Economic impact
    • Social Impact
    • Technical Impact
    • Environmental Impact
    • Legal Impact

Market Size by Region

  • Chart on Market share by geography 2021-2027 (%)
  • Data Table on Market share by geography 2021-2027(%)
  • North America
    • Chart on Market share by country 2021-2027 (%)
    • Data Table on Market share by country 2021-2027(%)
    • USA
      • Exhibit: Chart on Market share 2021-2027 (%)
      • Exhibit: Market size and forecast 2021-2027 ($ million)
    • Canada
      • Exhibit: Chart on Market share 2021-2027 (%)
      • Exhibit: Market size and forecast 2021-2027 ($ million)
  • Europe
    • Chart on Market share by country 2021-2027 (%)
    • Data Table on Market share by country 2021-2027(%)
    • Germany
      • Exhibit: Chart on Market share 2021-2027 (%)
      • Exhibit: Market size and forecast 2021-2027 ($ million)
    • Spain
      • Exhibit: Chart on Market share 2021-2027 (%)
      • Exhibit: Market size and forecast 2021-2027 ($ million)
    • France
      • Exhibit: Chart on Market share 2021-2027 (%)
      • Exhibit: Market size and forecast 2021-2027 ($ million)
    • UK
      • Exhibit: Chart on Market share 2021-2027 (%)
      • Exhibit: Market size and forecast 2021-2027 ($ million)
    • Rest of Europe
      • Exhibit: Chart on Market share 2021-2027 (%)
      • Exhibit: Market size and forecast 2021-2027 ($ million)
  • Asia Pacific
    • Chart on Market share by country 2021-2027 (%)
    • Data Table on Market share by country 2021-2027(%)
    • China
      • Exhibit: Chart on Market share 2021-2027 (%)
      • Exhibit: Market size and forecast 2021-2027 ($ million)
    • India
      • Exhibit: Chart on Market share 2021-2027 (%)
      • Exhibit: Market size and forecast 2021-2027 ($ million)
    • Japan
      • Exhibit: Chart on Market share 2021-2027 (%)
      • Exhibit: Market size and forecast 2021-2027 ($ million)
    • South Korea
      • Exhibit: Chart on Market share 2021-2027 (%)
      • Exhibit: Market size and forecast 2021-2027 ($ million)
    • Rest of Asia Pacific
      • Exhibit: Chart on Market share 2021-2027 (%)
      • Exhibit: Market size and forecast 2021-2027 ($ million)
  • Latin America
    • Chart on Market share by country 2021-2027 (%)
    • Data Table on Market share by country 2021-2027(%)
    • Brazil
      • Exhibit: Chart on Market share 2021-2027 (%)
      • Exhibit: Market size and forecast 2021-2027 ($ million)
    • Rest of South America
      • Exhibit: Chart on Market share 2021-2027 (%)
      • Exhibit: Market size and forecast 2021-2027 ($ million)
  • Middle East & Africa (MEA)
    • Chart on Market share by country 2021-2027 (%)
    • Data Table on Market share by country 2021-2027(%)
    • GCC Countries
      • Exhibit: Chart on Market share 2021-2027 (%)
      • Exhibit: Market size and forecast 2021-2027 ($ million)
    • South Africa
      • Exhibit: Chart on Market share 2021-2027 (%)
      • Exhibit: Market size and forecast 2021-2027 ($ million)
    • Rest of MEA
      • Exhibit: Chart on Market share 2021-2027 (%)
      • Exhibit: Market size and forecast 2021-2027 ($ million)

KEY COMPANY PROFILES

  • Competitive Landscape
    • Total number of companies covered
      • Exhibit: companies covered in the report, 2021
    • Top companies market positioning
      • Exhibit: company positioning matrix, 2021
    • Top companies market Share
      • Exhibit: Pie chart analysis on company market share, 2021(%)

Methodology

For the Bioenergy Market, our research methodology involved a mixture of primary and secondary data sources. Key steps involved in the research process are listed below:

1. Information Procurement: This stage involved the procurement of Market data or related information via primary and secondary sources. The various secondary sources used included various company websites, annual reports, trade databases, and paid databases such as Hoover's, Bloomberg Business, Factiva, and Avention. Our team did 45 primary interactions Globally which included several stakeholders such as manufacturers, customers, key opinion leaders, etc. Overall, information procurement was one of the most extensive stages in our research process.

2. Information Analysis: This step involved triangulation of data through bottom-up and top-down approaches to estimate and validate the total size and future estimate of the Bioenergy Market.

3. Report Formulation: The final step entailed the placement of data points in appropriate Market spaces in an attempt to deduce viable conclusions.

4. Validation & Publishing: Validation is the most important step in the process. Validation & re-validation via an intricately designed process helped us finalize data points to be used for final calculations. The final Market estimates and forecasts were then aligned and sent to our panel of industry experts for validation of data. Once the validation was done the report was sent to our Quality Assurance team to ensure adherence to style guides, consistency & design.

Analyst Support

Customization Options

With the given market data, our dedicated team of analysts can offer you the following customization options are available for the Bioenergy Market:

Product Analysis: Product matrix, which offers a detailed comparison of the product portfolio of companies.

Regional Analysis: Further analysis of the Bioenergy Market for additional countries.

Competitive Analysis: Detailed analysis and profiling of additional Market players & comparative analysis of competitive products.

Go to Market Strategy: Find the high-growth channels to invest your marketing efforts and increase your customer base.

Innovation Mapping: Identify racial solutions and innovation, connected to deep ecosystems of innovators, start-ups, academics, and strategic partners.

Category Intelligence: Customized intelligence that is relevant to their supply Markets will enable them to make smarter sourcing decisions and improve their category management.

Public Company Transcript Analysis: To improve the investment performance by generating new alpha and making better-informed decisions.

Social Media Listening: To analyze the conversations and trends happening not just around your brand, but around your industry as a whole, and use those insights to make better Marketing decisions.

$5,300

REQUEST FOR SAMPLE

Please verify that you're not a robot to proceed!
Want to customize this report? REQUEST FREE CUSTOMIZATION

FAQs

Global Bioenergy Market size was valued at USD 127.71 Billion in 2023 poised to grow from USD 137.29 Billion in 2024 to USD 244.85 Billion by 2032, growing at a CAGR of 7.5% in the forecast period (2025-2032).

With intense competition across the global bioenergy market, the major players in this industry are involving themselves in innovating and pushing for bioenergy technology advancements and make it more sustainable solutions. Siemens AG, Neste Corporation, Enel Green Power, and Drax Group are a few major players operating in the bioenergy production, renewable energy solutions, and biomass power sectors. They make about including advanced biofuels and biogas technologies within their contingent systems waste-to-energy in enhancing their market shares in global sustainability and government mandates on reducing carbon emissions. 'Siemens AG (Germany)', 'Neste Corporation (Finland)', 'Drax Group (United Kingdom)', 'Enel Green Power (Italy)', 'ADM (Archer Daniels Midland Company) (United States)', 'Valero Energy Corporation (United States)', 'Pacific Ethanol (United States)', 'Renewable Energy Group (United States)', 'BioEnergy DevCo (United States)', 'Zhengzhou Zhongding Bioenergy Co., Ltd. (China)', 'Vivergo Fuels (United Kingdom)', 'POET LLC (United States)', 'Abengoa (Spain)', 'Royal Dutch Shell (Netherlands/United Kingdom)', 'Sugarcane Bioenergy (Brazil)'

Policies and regulations are fundamental driving factors of the global bioenergy market; nations across the globe are developing ambitious renewable energy targets and establishing laws for subsidies, tax incentives, and mandates for bioenergy consumption. Such supportive policies fuel investments in bioenergy technologies and speed up transition to cleaner energy sources, all things being equal.

Rising Investment in Advanced Biofuels: Advanced biofuels, especially second and third generation biofuels, are rapidly gathering investments in the global bioenergy market. While non-food crops and waste materials are the sources of these biofuels, their sustainable nature, greater energy yields, and less environmental impact sound to life the proliferation of the market.

Europe is dominating the global bioenergy market due to strong policy support, ambitious renewable energy targets, and extensive infrastructure for bioenergy production and distribution. The European Union commits to reduce greenhouse gas emissions levels and attaining carbon neutrality by 2050, which in turn induces investments in sustainable bioenergy solutions such as biomass, biogas, and biofuels. In this regard, there are well-functioning waste management systems and agriculture practices in Europe and that provides an abundance of inputs for the feedstock necessary in bioenergy production. Government incentives like subsidization and renewable energy mandates together with technology breakthroughs consolidated Europe's leadership in the global bioenergy market outlook, thus compounding growth and spreading bioenergy throughout Europe.

Want to customize this report? This report can be personalized according to your needs. Our analysts and industry experts will work directly with you to understand your requirements and provide you with customized data in a short amount of time. We offer $1000 worth of FREE customization at the time of purchase.

AGC3x.webp
Aisin3x.webp
ASKA P Co. LTD3x.webp
BD3x.webp
BILL & MELIDA3x.webp
BOSCH3x.webp
CHUNGHWA TELECOM3x.webp
DAIKIN3x.webp
DEPARTMENT OF SCIENCE & TECHNOLOGY3x.webp
ETRI3x.webp
Fiti Testing3x.webp
GERRESHEIMER3x.webp
HENKEL3x.webp
HITACHI3x.webp
HOLISTIC MEDICAL CENTRE3x.webp
Institute for information industry3x.webp
JAXA3x.webp
JTI3x.webp
Khidi3x.webp
METHOD.3x.webp
Missul E&S3x.webp
MITSUBISHI3x.webp
MIZUHO3x.webp
NEC3x.webp
Nippon steel3x.webp
NOVARTIS3x.webp
Nttdata3x.webp
OSSTEM3x.webp
PALL3x.webp
Panasonic3x.webp
RECKITT3x.webp
Rohm3x.webp
RR KABEL3x.webp
SAMSUNG ELECTRONICS3x.webp
SEKISUI3x.webp
Sensata3x.webp
SENSEAIR3x.webp
Soft Bank Group3x.webp
SYSMEX3x.webp
TERUMO3x.webp
TOYOTA3x.webp
UNDP3x.webp
Unilever3x.webp
YAMAHA3x.webp
Yokogawa3x.webp

Feedback From Our Clients

Global Bioenergy Market
Bioenergy Market

Report ID: SQMIG55F2066

[email protected]
USA +1 351-333-4748

BUY NOW GET FREE SAMPLE