Bike Sharing Market Size, Share, and Growth Analysis

Bike Sharing Market

Bike Sharing Market By Type (Traditional Bike, E-Bike), By System (Docked, Dock Less), By Duration, By Region - Industry Forecast 2025-2032


Report ID: SQMIG45E2275 | Region: Global | Published Date: December, 2024
Pages: 160 |Tables: 86 |Figures: 71

Format - word format excel data power point presentation

Bike Sharing Market Insights

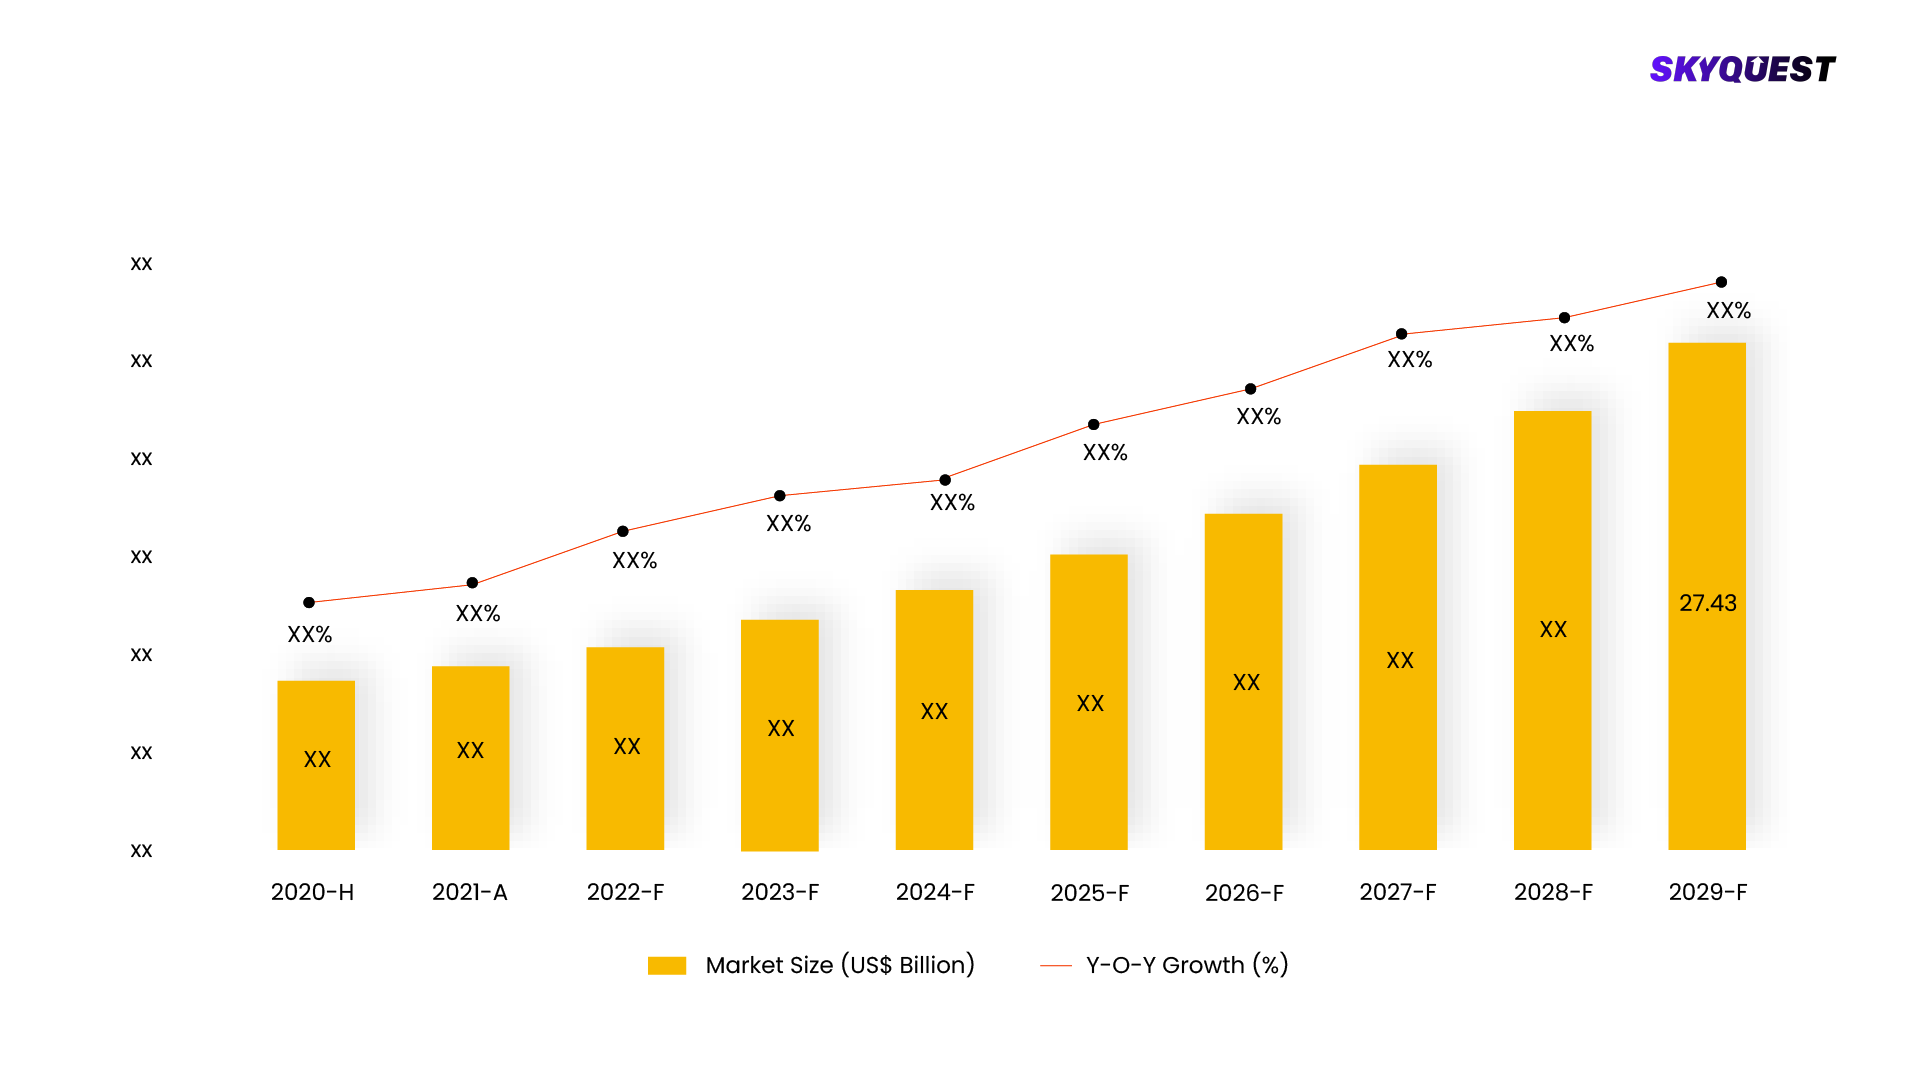
Bike Sharing Market size was valued at USD 7.85 Billion in 2023 and is poised to grow from USD 8.61 Billion in 2024 to USD 16.4 Billion by 2032, growing at a CAGR of 9.65% during the forecast period (2025-2032).

The major growth driver for the bike sharing market is the exponential increase of regular office commuters preferring carpool and bike pool services. In addition, customers are opting for ride-hailing and ride-sharing services which is booming the market share of bike sharing companies such as Uber and Ola. This is as a result of the extension of services by these companies in addition to flexibility in the selection of pick-up and drop places. In addition, expansion of the bike sharing sector is boosted by an enormous increase in the number of diversified ride-hailing and ride-sharing services, ranging from bike and vehicle sharing, even for short distances. Moreover, contrasted with more conventional transport service providers, they provide benefits such as door-step pick-up and drop that is more convenient than traditional transport services, information regarding co-passengers, and are presumably to be priced lower while this will most probably lure in even more demand for ride-sharing services. Furthermore, most service operators provide various amenities, discounts, and offers, such as the monthly pass for shared rides, to make the daily commute affordable and promote the rapid growth of the bike-sharing industry. The governments in most parts of the world have launched a series of promotional campaigns targeting the use of e-bikes. For instance, most governments across the globe are eager to address environmental problems by replacing fuel-based cars with electric ones.

Market snapshot - 2025-2032

Global Market Size

USD 7.85 Billion

Largest Segment

Traditional/Conventional

Fastest Growth

E-Bikes

Growth Rate

9.65% CAGR

Global Bike Sharing Market ($ Bn)
Country Share for North America Region (%)

To get more reports on the above market click here to Buy The Report

Bike Sharing Market Segments Analysis

Global Bike Sharing Market is segmented by Type, System, Duration, and Region. Based on Type, the market is segmented into Traditional Bike, E-Bike.  Based on System, the market is segmented into Docked, Dock Less.  Based on Duration, the market is segmented into Short Term, Long Term. Based on Region, the market is segmented into North America, Europe, Asia Pacific, Latin America and Middle East & and Africa.

Analysis by Bike Type

Traditional or conventional bikes have been the standard for years in the bike-sharing market as a segment. Given their wide accessibility range, simplicity, affordability, and easy maintenance, these have given them widespread acceptance. Conventional bikes were used in many of the first bike-sharing programs, which laid a solid basis for this market. They are mostly in use in cities with perfectly paved bike paths. There, riders could cover short distances without any effort. Conventional bikes can be very useful for commutating and just fun rides as they offer relatively smooth rides. Electric bikes are finding their value, but conventional bikes have still penetrated a major share of the market.

Electric bikes or "e-bikes" are an emerging product in the bike-sharing market, as they have several key characteristics that make them poised for fast growth in this space. Increasing demand for convenient and efficient transit is strong in cities where commutes can be long or steep. E-bikes are more appealing to a broader demographic because they offer a useful alternative to both cars and traditional bicycles. Overall, e-bikes are a great option for communities seeking to make greener traveling choices available under the sustainability movement's banner. At relatively higher prices, advanced battery technology, and supportive government policies, they are sure to fly off the stores' shelves soon and grab an increased market share in the coming years.

Analysis by Sharing System

Historically, the docked bike sharing system has dominated the market. This means that, in this type of service, customers are expected to collect and return the bikes at appropriate docking stations. Its planned way of how the bikes is returned to their dedicated areas makes it easier for operators to manage and maintain the fleet, accounting for the reason why it won a broad ground in several cities globally. The docked system has been wonderfully utilized in cities such as Barcelona and Paris to demonstrate they can work in a city environment. Ironically, however, docked systems are now increasingly being substituted by dockless competitors.

The dockless bike-sharing segment, with the fastest rate of growth, is a type of bike-sharing system in which customers can rent bikes without needing fixed docking stations. Thus, it makes it more accessible and liberative for them. Bikes are more appealing because users can pick up and drop them anywhere within a geofenced area, primarily because it is practical in large cities where there could be a lack of docking infrastructure. Bike-sharing is gaining more popularity because it is easy to use. Dockless systems, however, are even more popular with younger, tech-savvy users. Operators can now easily manage their dockless fleets because of advances in GPS tracking and mobile technologies. The dockless bike-sharing concept is expected to surge dramatically in the next years as cities continue embracing new transit options.

Global Bike Sharing Market by Bike Type

To get detailed analysis on other segments, Request For Free Sample Report

Bike Sharing Market Regional Insights

Cities the size of New York, San Francisco, and Montreal now have mature bike-sharing systems. North America, which encompasses cities such as New York, San Francisco, and Montreal, leads the world in city bike sharing. The region benefits from a tight integration of technology, world-class infrastructure, and a greater importance of public health and sustainability. Cities have invested heavily into bicycle-sharing programs as part of a traffic congestion eases strategy with green traveling alternatives. North America enjoys a strong market position; further leading factors are the presence of many industry leaders' bike-sharing firm companies. In addition, more and more people becoming aware of the health benefits from riding propels more people towards the bike-sharing programs, thus making them an attractive option for both leisure and urban commutes.

Asia-Pacific would witness the fastest growth in bike-sharing as it was witnessed to accompany rapid urbanization and the need for cost-effective transportation options there. China and India are at the fore of this, as dockless bike-sharing services have gained popularity in cities such as Beijing and Shanghai. People facing congested metropolitan environments find such solutions appealing because they are flexible and convenient. The initiatives in the market also include government measures, which encourage cycling as an environmentally friendly medium of transportation. Further, rising disposable incomes and a trend towards more eco-friendly modes of transportation are supporting growth prospects for bike-sharing across Asia-Pacific.

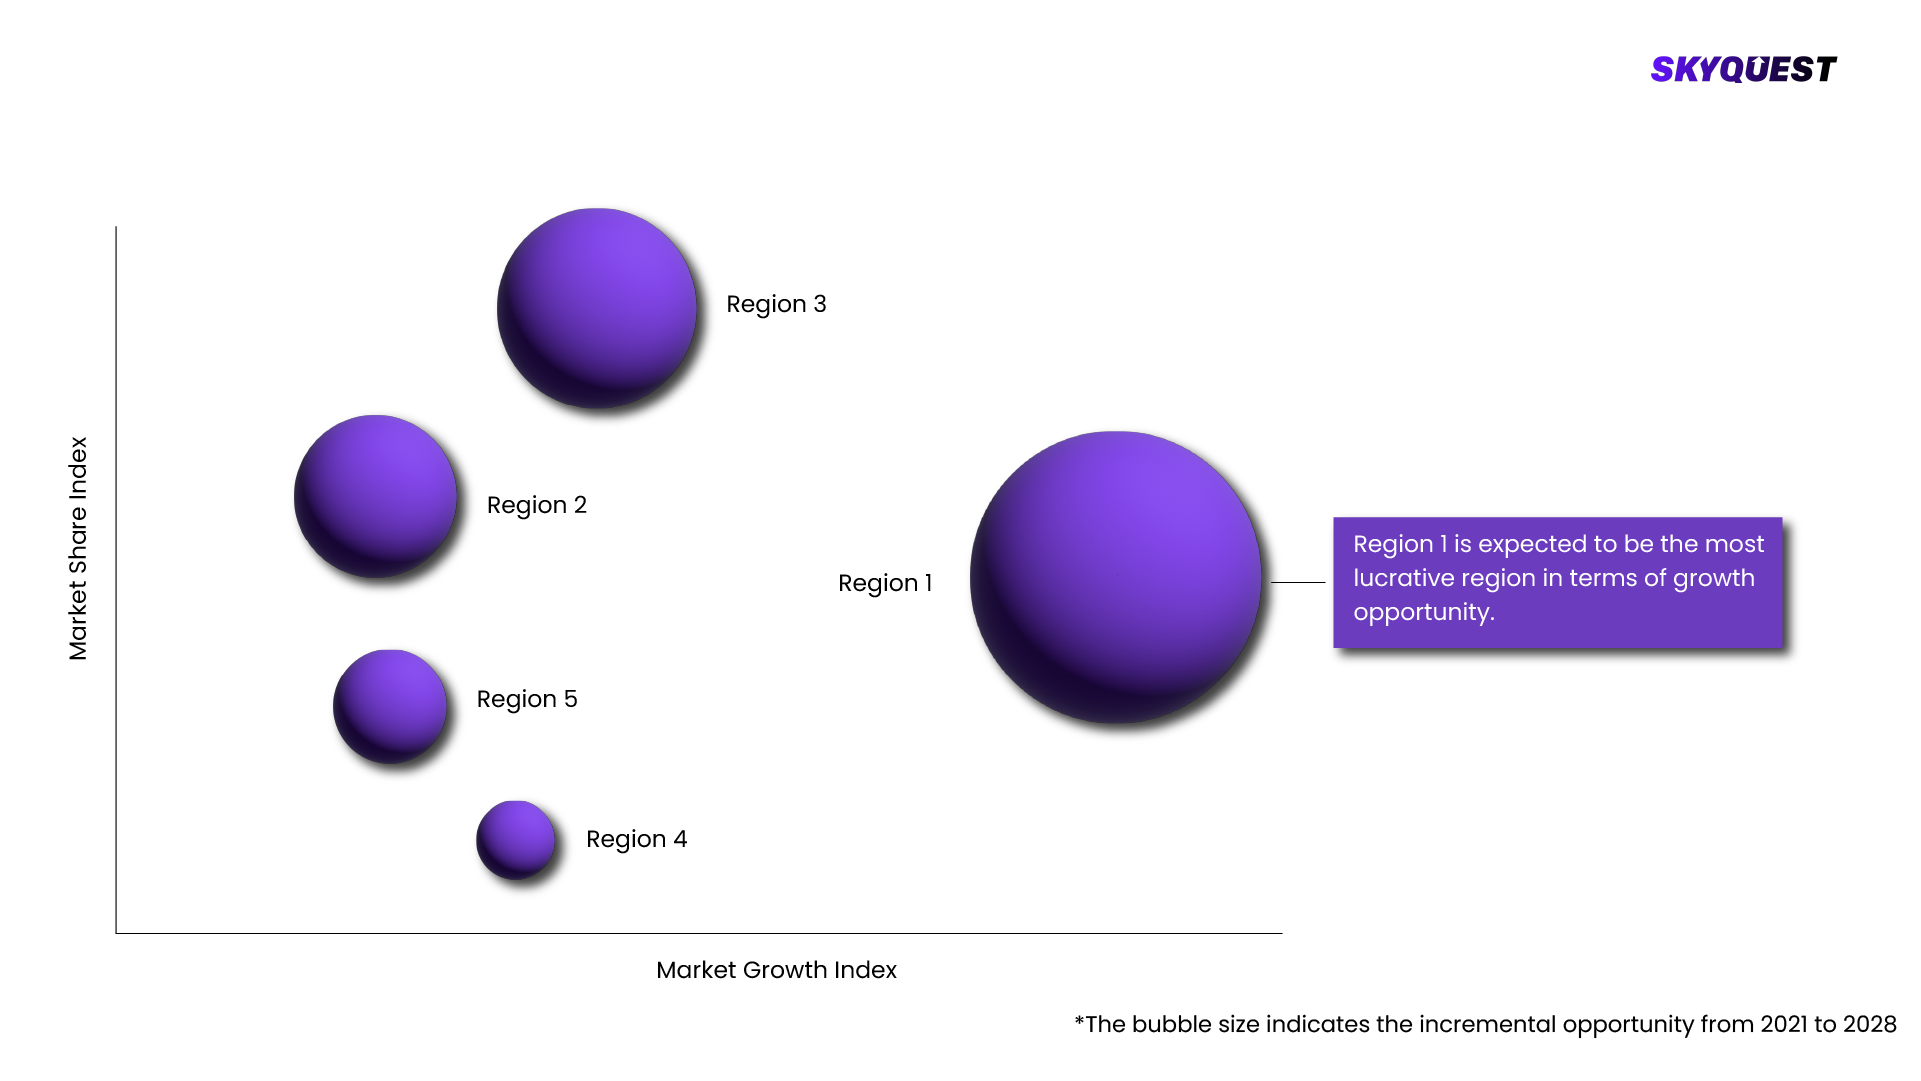
Global Bike Sharing Market By Geography
  • Largest
  • Fastest

To know more about the market opportunities by region and country, click here to
Buy The Complete Report

Bike Sharing Market Dynamics

Bike Sharing Market Drivers

Growing Urbanization

  • As cities are expanding and so are the populations, urbanization mainly drives the bicycle-sharing business. Due to this rapid growth of traffic, proper transit options are required. The residents and tourists can travel short distances easily with the help of bicycle-sharing systems, which offer a convenient substitute. Bike sharing comes across as a flexible and environmentally friendly alternative as townships are eager to provide more alternatives for transportation while cutting their dependence on private vehicles. Moreover, bike sharing can be integrated with public transport to maximize the sum mobility and accessibility of urban regions making it a convenient alternative for citizens to access the first and last mile for their trips.

Rising Environmental Awareness

  • The awareness of issues related to air pollution and climate change feeds the interest of people in eco-friendly transportation solutions such as bike sharing. As more environmental challenges receive attention, people are looking for ways to reduce carbon footprint. It encourages individuals to use bicycles instead of using cars, thus saving greenhouse gas emissions while the air quality improves in bike-sharing areas. This is in response to the goals set for global sustainability, and the policies of urban issues that strive to make cities healthier and more habitable. Furthermore, where governments and organizations are investing in cycling-friendly infrastructure, groups of consumers concerned with the environmental issue and now seeking ethical choices in transport find them increasingly attractive to bike-sharing programs.

Bike Sharing Market Restraints

Infrastructure Limitations

  • A lack of proper infrastructure in most locations is among the primary barriers affecting the bike-sharing industry. Without proper bike lanes and safe parking areas, not to mention cycling-friendly roads, the actual or potential customer might feel uneasy or unwilling to use bike-sharing services. It has the potential for accidents because improper infrastructure creates conflicts with motor vehicles. In addition, local jurisdictions with very small budgets may not be able to invest in the infrastructures needed to support a bike-sharing program. This lack of funding can limit the scalability and viability of bike-sharing systems, which can affect acceptance rates and the performance of the service.

Operational Constraints

  • The bike-sharing market is highly restricted by operational constraints. Management, maintenance, and theft prevention of bikes by operators are likely to be cumbersome and expensive. The bikes ought to be supported by efficient logistics combined with the right technology that ensures there is always a bike available at the time and when users require them. Significant costs of operating would significantly limit entry into the market by new competitors, especially small-scale businesses which have less financial muscle compared to more established companies. In addition, various problems such as destruction of the bikes and vandalism may add further stress on effective functioning and profitability of bike-sharing systems. Any bike-sharing scheme requires operating managers to develop sustainable systems for bike management and maintenance while providing frictionless experience for riders.

Request Free Customization of this report to help us to meet your business objectives.

Bike Sharing Market Competitive Landscape

For firms that offer unique models, such as docked systems and dockless systems, there exist Lime, Spin, and Citi Bike. Competitiveness drives an impetus toward cost innovation, tech innovation, and total value of service innovativeness. A common way to build market reach is through collaborations with other providers of public transport and urban governments. Business groups whose focus is on friendly procedures and client experience are predicted to transform this new market as sustainability becomes popular.

Top Players in Bike Sharing Market

  • Lime 
  • Tembici 
  • LYft, Inc. 
  • Anywheel Pte. Ltd. 
  • JCDecaux 
  • SG Bike Pte Ltd 
  • Uber Technologies, Inc. 
  • Bond Mobility AG 
  • Bird Rides, Inc 
  • BIXI 
  • TIER Mobility SE 
  • Mobike 
  • Youon Technology Co., Ltd.

Recent Developments

  • March 2023: MYBYK launched two electric variants of bicycles named MYBYK Electric and MYBYK Electric Cargo. Both the versions cater to the needs of locals and visitors, as the MYBYK Electric model offers easy connectivity for their first and last miles, while the MYBYK Electric Cargo is aimed at gig workers and seeks the solution to all problems that now accompany last-mile deliveries.
  • February 2023: Bike-sharing service Nextbike was acquired by TIER Mobility, and since then, it has strengthened its base in the country of Spain. Early this year, the service was going to be launched in Palma de Mallorca, Getxo, Mislata, and the Barcelona Metropolitan Region. The service is called AMBici within and around the city of Barcelona.
  • June 2022: Anywheel Pte. Ltd. commercially expanded with the introduction of shared bikes services in Ang Mo Kio, Pasir Ris, Punggol, and Tampines. Subsequent to clearance from the Land Transport Authority to quadruple the size of its fleet to 30,000 shared bicycles, Anywheel has expanded the territories that it covers.

Bike Sharing Key Market Trends

Bike Sharing Market SkyQuest Analysis

SkyQuest's ABIRAW (Advanced Business Intelligence, Research & Analysis Wing) is our Business Information Services team that Collects, Collates, Correlates, and Analyses the Data collected by means of Primary Exploratory Research backed by robust Secondary Desk research.

As per SkyQuest analysis, in the future, the bike sharing market is going to develop due to urbanization, environmental consciousness, and technological improvement. Although there are several difficulties, operating and infrastructure-related, yet the whole potential is tremendous, with growing integration with public transport and developing innovative solutions. In this competitive market, business leaders who prioritize sustainability, strategic alliances, and user experience will be the most predictable winners. Bike sharing will prove crucial to redeveloping urban mobility and adopting eco-friendly travel options as cities develop and focus on sustainable transport. This will make urban settings healthier and more accessible to all people.

Report Metric Details
Market size value in 2023 USD 7.85 Billion
Market size value in 2032 USD 16.4 Billion
Growth Rate 9.65%
Base year 2024
Forecast period 2025-2032
Forecast Unit (Value) USD Billion
Segments covered
  • Type
    • Traditional Bike
    • E-Bike
  • System
    • Docked
    • Dock Less
  • Duration
    • Short Term
    • Long Term
Regions covered North America (US, Canada), Europe (Germany, France, United Kingdom, Italy, Spain, Rest of Europe), Asia Pacific (China, India, Japan, Rest of Asia-Pacific), Latin America (Brazil, Rest of Latin America), Middle East & Africa (South Africa, GCC Countries, Rest of MEA)
Companies covered
  • Lime 
  • Tembici 
  • LYft, Inc. 
  • Anywheel Pte. Ltd. 
  • JCDecaux 
  • SG Bike Pte Ltd 
  • Uber Technologies, Inc. 
  • Bond Mobility AG 
  • Bird Rides, Inc 
  • BIXI 
  • TIER Mobility SE 
  • Mobike 
  • Youon Technology Co., Ltd.
Customization scope

Free report customization with purchase. Customization includes:-

  • Segments by type, application, etc
  • Company profile
  • Market dynamics & outlook
  • Region

To get a free trial access to our platform which is a one stop solution for all your data requirements for quicker decision making. This platform allows you to compare markets, competitors who are prominent in the market, and mega trends that are influencing the dynamics in the market. Also, get access to detailed SkyQuest exclusive matrix.

Buy The Complete Report to read the analyzed strategies adopted by the top vendors either to retain or gain market share

Table Of Content

Executive Summary

Market overview

  • Exhibit: Executive Summary – Chart on Market Overview
  • Exhibit: Executive Summary – Data Table on Market Overview
  • Exhibit: Executive Summary – Chart on Bike Sharing Market Characteristics
  • Exhibit: Executive Summary – Chart on Market by Geography
  • Exhibit: Executive Summary – Chart on Market Segmentation
  • Exhibit: Executive Summary – Chart on Incremental Growth
  • Exhibit: Executive Summary – Data Table on Incremental Growth
  • Exhibit: Executive Summary – Chart on Vendor Market Positioning

Parent Market Analysis

Market overview

Market size

  • Market Dynamics
    • Exhibit: Impact analysis of DROC, 2021
      • Drivers
      • Opportunities
      • Restraints
      • Challenges
  • SWOT Analysis

KEY MARKET INSIGHTS

  • Technology Analysis
    • (Exhibit: Data Table: Name of technology and details)
  • Pricing Analysis
    • (Exhibit: Data Table: Name of technology and pricing details)
  • Supply Chain Analysis
    • (Exhibit: Detailed Supply Chain Presentation)
  • Value Chain Analysis
    • (Exhibit: Detailed Value Chain Presentation)
  • Ecosystem Of the Market
    • Exhibit: Parent Market Ecosystem Market Analysis
    • Exhibit: Market Characteristics of Parent Market
  • IP Analysis
    • (Exhibit: Data Table: Name of product/technology, patents filed, inventor/company name, acquiring firm)
  • Trade Analysis
    • (Exhibit: Data Table: Import and Export data details)
  • Startup Analysis
    • (Exhibit: Data Table: Emerging startups details)
  • Raw Material Analysis
    • (Exhibit: Data Table: Mapping of key raw materials)
  • Innovation Matrix
    • (Exhibit: Positioning Matrix: Mapping of new and existing technologies)
  • Pipeline product Analysis
    • (Exhibit: Data Table: Name of companies and pipeline products, regional mapping)
  • Macroeconomic Indicators

COVID IMPACT

  • Introduction
  • Impact On Economy—scenario Assessment
    • Exhibit: Data on GDP - Year-over-year growth 2016-2022 (%)
  • Revised Market Size
    • Exhibit: Data Table on Bike Sharing Market size and forecast 2021-2027 ($ million)
  • Impact Of COVID On Key Segments
    • Exhibit: Data Table on Segment Market size and forecast 2021-2027 ($ million)
  • COVID Strategies By Company
    • Exhibit: Analysis on key strategies adopted by companies

MARKET DYNAMICS & OUTLOOK

  • Market Dynamics
    • Exhibit: Impact analysis of DROC, 2021
      • Drivers
      • Opportunities
      • Restraints
      • Challenges
  • Regulatory Landscape
    • Exhibit: Data Table on regulation from different region
  • SWOT Analysis
  • Porters Analysis
    • Competitive rivalry
      • Exhibit: Competitive rivalry Impact of key factors, 2021
    • Threat of substitute products
      • Exhibit: Threat of Substitute Products Impact of key factors, 2021
    • Bargaining power of buyers
      • Exhibit: buyers bargaining power Impact of key factors, 2021
    • Threat of new entrants
      • Exhibit: Threat of new entrants Impact of key factors, 2021
    • Bargaining power of suppliers
      • Exhibit: Threat of suppliers bargaining power Impact of key factors, 2021
  • Skyquest special insights on future disruptions
    • Political Impact
    • Economic impact
    • Social Impact
    • Technical Impact
    • Environmental Impact
    • Legal Impact

Market Size by Region

  • Chart on Market share by geography 2021-2027 (%)
  • Data Table on Market share by geography 2021-2027(%)
  • North America
    • Chart on Market share by country 2021-2027 (%)
    • Data Table on Market share by country 2021-2027(%)
    • USA
      • Exhibit: Chart on Market share 2021-2027 (%)
      • Exhibit: Market size and forecast 2021-2027 ($ million)
    • Canada
      • Exhibit: Chart on Market share 2021-2027 (%)
      • Exhibit: Market size and forecast 2021-2027 ($ million)
  • Europe
    • Chart on Market share by country 2021-2027 (%)
    • Data Table on Market share by country 2021-2027(%)
    • Germany
      • Exhibit: Chart on Market share 2021-2027 (%)
      • Exhibit: Market size and forecast 2021-2027 ($ million)
    • Spain
      • Exhibit: Chart on Market share 2021-2027 (%)
      • Exhibit: Market size and forecast 2021-2027 ($ million)
    • France
      • Exhibit: Chart on Market share 2021-2027 (%)
      • Exhibit: Market size and forecast 2021-2027 ($ million)
    • UK
      • Exhibit: Chart on Market share 2021-2027 (%)
      • Exhibit: Market size and forecast 2021-2027 ($ million)
    • Rest of Europe
      • Exhibit: Chart on Market share 2021-2027 (%)
      • Exhibit: Market size and forecast 2021-2027 ($ million)
  • Asia Pacific
    • Chart on Market share by country 2021-2027 (%)
    • Data Table on Market share by country 2021-2027(%)
    • China
      • Exhibit: Chart on Market share 2021-2027 (%)
      • Exhibit: Market size and forecast 2021-2027 ($ million)
    • India
      • Exhibit: Chart on Market share 2021-2027 (%)
      • Exhibit: Market size and forecast 2021-2027 ($ million)
    • Japan
      • Exhibit: Chart on Market share 2021-2027 (%)
      • Exhibit: Market size and forecast 2021-2027 ($ million)
    • South Korea
      • Exhibit: Chart on Market share 2021-2027 (%)
      • Exhibit: Market size and forecast 2021-2027 ($ million)
    • Rest of Asia Pacific
      • Exhibit: Chart on Market share 2021-2027 (%)
      • Exhibit: Market size and forecast 2021-2027 ($ million)
  • Latin America
    • Chart on Market share by country 2021-2027 (%)
    • Data Table on Market share by country 2021-2027(%)
    • Brazil
      • Exhibit: Chart on Market share 2021-2027 (%)
      • Exhibit: Market size and forecast 2021-2027 ($ million)
    • Rest of South America
      • Exhibit: Chart on Market share 2021-2027 (%)
      • Exhibit: Market size and forecast 2021-2027 ($ million)
  • Middle East & Africa (MEA)
    • Chart on Market share by country 2021-2027 (%)
    • Data Table on Market share by country 2021-2027(%)
    • GCC Countries
      • Exhibit: Chart on Market share 2021-2027 (%)
      • Exhibit: Market size and forecast 2021-2027 ($ million)
    • South Africa
      • Exhibit: Chart on Market share 2021-2027 (%)
      • Exhibit: Market size and forecast 2021-2027 ($ million)
    • Rest of MEA
      • Exhibit: Chart on Market share 2021-2027 (%)
      • Exhibit: Market size and forecast 2021-2027 ($ million)

KEY COMPANY PROFILES

  • Competitive Landscape
    • Total number of companies covered
      • Exhibit: companies covered in the report, 2021
    • Top companies market positioning
      • Exhibit: company positioning matrix, 2021
    • Top companies market Share
      • Exhibit: Pie chart analysis on company market share, 2021(%)

Methodology

For the Bike Sharing Market, our research methodology involved a mixture of primary and secondary data sources. Key steps involved in the research process are listed below:

1. Information Procurement: This stage involved the procurement of Market data or related information via primary and secondary sources. The various secondary sources used included various company websites, annual reports, trade databases, and paid databases such as Hoover's, Bloomberg Business, Factiva, and Avention. Our team did 45 primary interactions Globally which included several stakeholders such as manufacturers, customers, key opinion leaders, etc. Overall, information procurement was one of the most extensive stages in our research process.

2. Information Analysis: This step involved triangulation of data through bottom-up and top-down approaches to estimate and validate the total size and future estimate of the Bike Sharing Market.

3. Report Formulation: The final step entailed the placement of data points in appropriate Market spaces in an attempt to deduce viable conclusions.

4. Validation & Publishing: Validation is the most important step in the process. Validation & re-validation via an intricately designed process helped us finalize data points to be used for final calculations. The final Market estimates and forecasts were then aligned and sent to our panel of industry experts for validation of data. Once the validation was done the report was sent to our Quality Assurance team to ensure adherence to style guides, consistency & design.

Analyst Support

Customization Options

With the given market data, our dedicated team of analysts can offer you the following customization options are available for the Bike Sharing Market:

Product Analysis: Product matrix, which offers a detailed comparison of the product portfolio of companies.

Regional Analysis: Further analysis of the Bike Sharing Market for additional countries.

Competitive Analysis: Detailed analysis and profiling of additional Market players & comparative analysis of competitive products.

Go to Market Strategy: Find the high-growth channels to invest your marketing efforts and increase your customer base.

Innovation Mapping: Identify racial solutions and innovation, connected to deep ecosystems of innovators, start-ups, academics, and strategic partners.

Category Intelligence: Customized intelligence that is relevant to their supply Markets will enable them to make smarter sourcing decisions and improve their category management.

Public Company Transcript Analysis: To improve the investment performance by generating new alpha and making better-informed decisions.

Social Media Listening: To analyze the conversations and trends happening not just around your brand, but around your industry as a whole, and use those insights to make better Marketing decisions.

$5,300

REQUEST FOR SAMPLE

Please verify that you're not a robot to proceed!
Want to customize this report? REQUEST FREE CUSTOMIZATION

FAQs

Bike Sharing Market size was valued at USD 7.85 Billion in 2023 and is poised to grow from USD 8.61 Billion in 2024 to USD 16.4 Billion by 2032, growing at a CAGR of 9.65% during the forecast period (2025-2032).

For firms that offer unique models, such as docked systems and dockless systems, there exist Lime, Spin, and Citi Bike. Competitiveness drives an impetus toward cost innovation, tech innovation, and total value of service innovativeness. A common way to build market reach is through collaborations with other providers of public transport and urban governments. Business groups whose focus is on friendly procedures and client experience are predicted to transform this new market as sustainability becomes popular. 'Lime ', 'Tembici ', 'LYft, Inc. ', 'Anywheel Pte. Ltd. ', 'JCDecaux ', 'SG Bike Pte Ltd ', 'Uber Technologies, Inc. ', 'Bond Mobility AG ', 'Bird Rides, Inc ', 'BIXI ', 'TIER Mobility SE ', 'Mobike ', 'Youon Technology Co., Ltd.'

As cities are expanding and so are the populations, urbanization mainly drives the bicycle-sharing business. Due to this rapid growth of traffic, proper transit options are required. The residents and tourists can travel short distances easily with the help of bicycle-sharing systems, which offer a convenient substitute. Bike sharing comes across as a flexible and environmentally friendly alternative as townships are eager to provide more alternatives for transportation while cutting their dependence on private vehicles. Moreover, bike sharing can be integrated with public transport to maximize the sum mobility and accessibility of urban regions making it a convenient alternative for citizens to access the first and last mile for their trips.

Integration with Public Transportation: It is probably one of the most important growth areas in the bike-sharing business public transport network integration. This strategy will further strengthen the position of bike-sharing in improving urban mobility by providing a complete mobility solution for its consumers. This would help cities solve the first and last mile problem and enable people to easily access public transport by making changes between bikes and public transportation seamless for cyclists. Such integration includes coordinated scheduling, integrated fare systems, and bike racks for use in stations. Besides energizing more people to ride with bike-sharing services, this trend supports greener urban transport thereby reducing traffic and improving the efficiency of public transport.

Cities the size of New York, San Francisco, and Montreal now have mature bike-sharing systems. North America, which encompasses cities such as New York, San Francisco, and Montreal, leads the world in city bike sharing. The region benefits from a tight integration of technology, world-class infrastructure, and a greater importance of public health and sustainability. Cities have invested heavily into bicycle-sharing programs as part of a traffic congestion eases strategy with green traveling alternatives. North America enjoys a strong market position; further leading factors are the presence of many industry leaders’ bike-sharing firm companies. In addition, more and more people becoming aware of the health benefits from riding propels more people towards the bike-sharing programs, thus making them an attractive option for both leisure and urban commutes.

Want to customize this report? This report can be personalized according to your needs. Our analysts and industry experts will work directly with you to understand your requirements and provide you with customized data in a short amount of time. We offer $1000 worth of FREE customization at the time of purchase.

AGC3x.webp
Aisin3x.webp
ASKA P Co. LTD3x.webp
BD3x.webp
BILL & MELIDA3x.webp
BOSCH3x.webp
CHUNGHWA TELECOM3x.webp
DAIKIN3x.webp
DEPARTMENT OF SCIENCE & TECHNOLOGY3x.webp
ETRI3x.webp
Fiti Testing3x.webp
GERRESHEIMER3x.webp
HENKEL3x.webp
HITACHI3x.webp
HOLISTIC MEDICAL CENTRE3x.webp
Institute for information industry3x.webp
JAXA3x.webp
JTI3x.webp
Khidi3x.webp
METHOD.3x.webp
Missul E&S3x.webp
MITSUBISHI3x.webp
MIZUHO3x.webp
NEC3x.webp
Nippon steel3x.webp
NOVARTIS3x.webp
Nttdata3x.webp
OSSTEM3x.webp
PALL3x.webp
Panasonic3x.webp
RECKITT3x.webp
Rohm3x.webp
RR KABEL3x.webp
SAMSUNG ELECTRONICS3x.webp
SEKISUI3x.webp
Sensata3x.webp
SENSEAIR3x.webp
Soft Bank Group3x.webp
SYSMEX3x.webp
TERUMO3x.webp
TOYOTA3x.webp
UNDP3x.webp
Unilever3x.webp
YAMAHA3x.webp
Yokogawa3x.webp

Feedback From Our Clients

Bike Sharing Market
Bike Sharing Market

Report ID: SQMIG45E2275

[email protected]
USA +1 351-333-4748

BUY NOW GET FREE SAMPLE