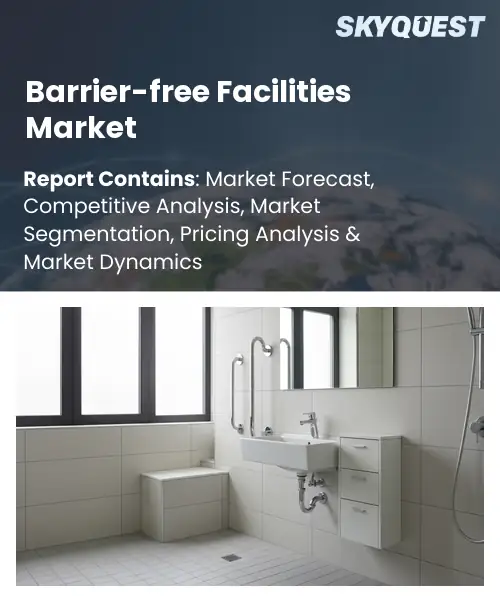
Barrier-free Facilities Market
Report ID: SQMIG60K2006
Report ID: SQMIG60K2006
[email protected]
USA +1 351-333-4748
Report ID:
SQMIG60K2006 |
Region:
Global |
Published Date: July, 2026
Pages:
157
|Tables:
119
|Figures:
77


Global Barrier-Free Facilities Market size was valued at USD 3.74 Billion in 2024 and is poised to grow from USD 3.95 Billion in 2025 to USD 6.16 Billion by 2033, growing at a CAGR of 5.7% during the forecast period (2026-2033).
The barrier‑free facilities market focuses on designing and constructing spaces that allow access for people with disabilities, seniors, and impairments. Its importance stems from fostering inclusive societies, meeting requirements, and unlocking a consumer segment. The primary driver is demographic change; aging populations in Europe, North America, and Japan raise demand for transit, housing, and venues. Legislative measures such as the Americans with Disabilities Act and the European Accessibility Act have shifted compliance from optional to mandatory, prompting firms to install ramps, tactile signage, and automatic doors. In a decade hotel chains like Marriott have introduced designed rooms, signaling market maturation. Technology integration represents a key catalyst propelling the barrier‑free facilities market toward global growth. As smart sensors, IoT platforms, and AI‑driven navigation systems become affordable, building owners can convert structures into interactive environments that automatically adjust lighting, door operation, and wayfinding cues for users. This capability reduces operational barriers and attracts tenants seeking inclusive experiences, evident in workplaces like Salesforce Tower where elevators and obstacle alerts have improved employee productivity. The resulting demand fuels investment in modular accessibility kits and engineering services, opening revenue streams for manufacturers and consultants while encouraging municipalities to adopt standards that further expand market size.
How is AI-driven automation reshaping the barrier‑free facilities market?
AI driven automation is redefining how barrier free facilities are designed, installed and maintained. Sensors embedded in doors, lifts and signage feed data to machine learning models that predict usage patterns and identify obstacles before they become hazards. Operators can program ramps to adjust slope based on crowd flow and can trigger auditory cues when a wheelchair approaches a doorway. Real time analytics enable facility managers to schedule cleaning and repairs without disrupting access. The market now favors solutions that blend robotics with cloud platforms, creating environments that adapt instantly to the needs of people with disabilities.KONE March 2024, launched an AI powered predictive maintenance platform for its elevators that continuously analyses sensor streams and automatically dispatches service robots when a fault is detected, reducing downtime and ensuring uninterrupted access for users with mobility challenges while lowering operational costs through enhanced reliability and user confidence.
Market snapshot - (2026-2033)
Global Market Size
USD 3.74 Billion
Largest Segment
Ramps
Fastest Growth
Tactile Guidance Systems
Growth Rate
5.7% CAGR
To get more insights on this market click here to Request a Free Sample Report
Global barrier-free facilities market is segmented by facility type, application, accessibility type, end user and region. Based on facility type, the market is segmented into Ramps, Elevators, Accessible Restrooms and Tactile Guidance Systems. Based on application, the market is segmented into Residential Buildings, Commercial Buildings, Public Infrastructure and Healthcare Facilities. Based on accessibility type, the market is segmented into Mobility Accessibility, Visual Accessibility and Hearing Accessibility. Based on end user, the market is segmented into Government, Commercial and Residential. Based on region, the market is segmented into North America, Europe, Asia Pacific, Latin America and Middle East & Africa.
Elevators segment dominates because they provide essential vertical circulation that complies with universal design standards, making multistorey environments accessible for all users. Their integration simplifies compliance with building codes, reduces physical barriers, and enhances property value, prompting developers to prioritize elevator installation. Continuous advances in smart control systems and space efficient designs further reinforce elevators as the cornerstone of barrier free infrastructure across varied building typologies throughout the lifecycle for owners.
Meanwhile, ramps segment is witnessing the strongest growth momentum as designers embrace modular, prefabricated solutions that accelerate construction timelines and lower costs. Emerging demand from retrofitting older structures and heightened awareness of inclusive design drive rapid adoption, positioning ramps as a catalyst for expanding barrier free market opportunities in urban contexts globally.
Visual accessibility segment dominates because it addresses the need for movement across physical spaces, influencing building layouts, entrance design, and circulation pathways. Stakeholders prioritize ramps, lifts, and widened doorways to meet legal mandates and user expectations, creating demand for solutions that remove obstacles for wheelchair and assistive device users. Innovation in sensor guided platforms and ergonomic standards reinforces its central role in shaping barrier free environments across residential, commercial, and public sectors.
Conversely, visual accessibility segment emerges as the key high growth area as tactile paving, audible signage, and smartphone based navigation tools gain traction among developers seeking inclusive design. Growing awareness of sensory friendly environments and regulatory incentives for blind friendly infrastructure accelerate adoption, positioning visual solutions to broaden market reach and stimulate innovative product pipelines.
To get detailed segments analysis, Request a Free Sample Report
Asia Pacific commands leadership in the Barrier-free Facilities Market through a confluence of demographic, regulatory and cultural forces. Rapidly aging societies across the region generate sustained demand for accessible infrastructure, prompting governments to embed inclusive design into building codes and urban planning guidelines. Strong public‑private partnerships fuel investment in universal design technologies, while a cultural emphasis on social responsibility drives corporations to prioritize accessibility as a brand differentiator. Advanced manufacturing capabilities and a mature construction sector enable cost‑effective integration of tactile signage, assistive lifts and barrier‑free pathways. Collectively these elements create a resilient ecosystem that sustains the region’s dominant market position. In addition, regional policy agendas increasingly link accessibility to broader sustainability targets, reinforcing investment cycles and encouraging continuous innovation across the value chain.
Japan Barrier-free Facilities Market
Barrier-free Facilities Market in Japan is shaped by a mature regulatory environment that mandates universal design in both new constructions and major retrofits. Strong advocacy from aging population groups combined with government incentives accelerates adoption of tactile flooring, audio‑visual guidance systems and barrier‑free transit solutions. Domestic manufacturers leverage precision engineering to supply high‑quality assistive hardware, while leading property developers integrate accessibility as a core criteria in premium projects.
South Korea Barrier-free Facilities Market
Barrier-free Facilities Market in South Korea benefits from proactive government policies that embed accessibility standards across public infrastructure and commercial real estate. Growing awareness of inclusive design among architects and contractors drives wider deployment of ramped entrances, braille signage and smart elevator systems. Homegrown technology firms contribute innovative sensor‑based navigation aids, while major retailers adopt barrier‑free store layouts to attract a broader consumer base, reinforcing the market’s momentum.
Europe’s Barrier-free Facilities Market is propelled by a comprehensive regulatory framework that embeds accessibility into building codes, transportation standards and public procurement criteria. The region’s demographic shift toward an older populace intensifies demand for environments that accommodate diverse mobility needs. Strong social welfare orientations encourage municipalities to prioritize universal design in urban renewal projects, while substantial public funding supports research into assistive technologies. Integration of accessibility with sustainability agendas creates synergies that attract private investment, and leading design firms champion inclusive aesthetics as a competitive advantage. Collectively these dynamics drive rapid expansion and solidify Europe’s position as a hub of innovation in barrier‑free solutions. Furthermore, cross‑border collaboration among research institutes and industry associations accelerates the diffusion of best practices, fostering a cohesive market environment that rewards forward‑looking accessibility strategies.
Germany Barrier-free Facilities Market
Barrier-free Facilities Market in Germany is anchored by rigorous national standards that require universal design in both public and private sectors. Strong engineering expertise supports the development of sophisticated lift systems, tactile wayfinding and adaptive bathroom solutions. Government incentives encourage retrofitting of historic buildings, while major construction firms embed accessibility checkpoints throughout project lifecycles. This systematic approach ensures that Germany remains a benchmark for high‑quality barrier‑free implementation.
United Kingdom Barrier-free Facilities Market
Barrier-free Facilities Market in United Kingdom experiences rapid expansion driven by progressive legislation that mandates accessibility in new housing and public infrastructure. Heightened public awareness and advocacy groups amplify pressure on developers to adopt inclusive design principles. Innovative firms introduce modular ramp systems and smart navigation aids that accelerate project timelines. Funding mechanisms for community upgrades further stimulate adoption, positioning United Kingdom as the fastest‑growing market within the European landscape.
France Barrier-free Facilities Market
Barrier-free Facilities Market in France is emerging as a dynamic segment supported by recent policy incentives that encourage accessibility upgrades in urban centers. Growing consumer expectations for inclusive retail and hospitality environments drive businesses to integrate tactile flooring and audio‑visual guidance. Collaborative efforts between design schools and technology startups foster creative solutions such as portable lift kits and interactive wayfinding apps. These initiatives collectively nurture a nascent yet promising market trajectory.
North America strengthens its position in the Barrier-free Facilities Market through a blend of regulatory momentum, technological leadership and consumer demand for inclusive environments. Federal and state guidelines increasingly embed accessibility requirements across transportation, commercial real estate and digital infrastructure, prompting developers to prioritize universal design from concept to completion. A vibrant ecosystem of technology firms delivers advanced sensor‑based navigation, adaptable lift platforms and integrated communication solutions that enhance user experience. Major retailers and hospitality brands adopt barrier‑free standards to broaden market reach, while public‑private partnerships fund large‑scale retrofitting of legacy structures. These coordinated efforts reinforce the region’s advancing role and attract sustained investment in accessibility innovations. Additionally, cross‑border collaborations with European research institutes facilitate knowledge exchange, driving continuous improvement of design guidelines and fostering a culture of innovation that further consolidates North America’s market leadership.
United States Barrier-free Facilities Market
Barrier-free Facilities Market in United States is propelled by federal standards such as the Accessibility Act, which shape design practices across commercial and civic projects. A construction sector integrates universal design principles early, supported by an ecosystem of suppliers offering cutting‑edge ramp systems, tactile indicators and intelligent elevators. Consumer advocacy groups amplify demand for inclusive retail spaces, while technology hubs develop AI‑driven navigation tools that enhance independence for users with diverse abilities.
Canada Barrier-free Facilities Market
Barrier-free Facilities Market in Canada benefits from a collaborative policy environment that aligns provincial building codes with national accessibility objectives. Emphasis on inclusive design drives adoption of barrier‑free transit stations, accessible housing units and public spaces equipped with tactile wayfinding and auditory alerts. Innovation clusters in major cities produce smart mobility aids and sensor‑based assistance platforms, while government grants encourage retrofitting of historic structures. Together these factors nurture a progressive market focused on universal accessibility.
To know more about the market opportunities by region and country, click here to
Buy The Complete Report
Increasing Public Awareness
Regulatory Framework Strengthening
High Upfront Installation Costs
Limited Technical Expertise
Request Free Customization of this report to help us to meet your business objectives.
The market is shaped by incumbents leveraging strategic acquisitions of niche accessibility firms, forming joint ventures with architectural designers, and deploying IoT‑enabled wayfinding solutions to differentiate their barrier‑free product lines. Recent collaborations between leading construction equipment providers and smart‑sensor startups illustrate how technology integration is accelerating entry barriers and expanding service ecosystems.
Top Player’s Company Profile
Recent Developments
SkyQuest’s ABIRAW (Advanced Business Intelligence, Research & Analysis Wing) is our Business Information Services team that Collects, Collates, Correlates, and Analyses the Data collected by means of Primary Exploratory Research backed by robust Secondary Desk research. As per SkyQuest analysis the global barrier‑free facilities market is projected to expand from $3.95 billion in 2025 to $6.16 billion by 2033, driven primarily by rising public awareness of inclusive design which pushes organisations to invest in accessible infrastructure. A second strong catalyst is the rapid integration of smart accessibility technologies such as AI‑powered sensors and IoT‑linked elevators that enhance user experience and lower operating costs. The market is most vigorous in the Asia Pacific region where demographic ageing and supportive policies fuel demand. Elevators remain the dominant segment because they provide essential vertical circulation and simplify compliance, while high upfront installation costs act as a significant restraint limiting faster adoption.
| Report Metric | Details |
|---|---|
| Market size value in 2024 | USD 3.74 Billion |
| Market size value in 2033 | USD 6.16 Billion |
| Growth Rate | 5.7% |
| Base year | 2024 |
| Forecast period | (2026-2033) |
| Forecast Unit (Value) | USD Billion |
| Segments covered |
|
| Regions covered | North America (US, Canada), Europe (Germany, France, United Kingdom, Italy, Spain, Rest of Europe), Asia Pacific (China, India, Japan, Rest of Asia-Pacific), Latin America (Brazil, Rest of Latin America), Middle East & Africa (South Africa, GCC Countries, Rest of MEA) |
| Companies covered |
|
| Customization scope | Free report customization with purchase. Customization includes:-
|
To get a free trial access to our platform which is a one stop solution for all your data requirements for quicker decision making. This platform allows you to compare markets, competitors who are prominent in the market, and mega trends that are influencing the dynamics in the market. Also, get access to detailed SkyQuest exclusive matrix.
Table Of Content
Executive Summary
Market overview
Parent Market Analysis
Market overview
Market size
KEY MARKET INSIGHTS
COVID IMPACT
MARKET DYNAMICS & OUTLOOK
Market Size by Region
KEY COMPANY PROFILES
Methodology
For the Barrier-free Facilities Market, our research methodology involved a mixture of primary and secondary data sources. Key steps involved in the research process are listed below:
1. Information Procurement: This stage involved the procurement of Market data or related information via primary and secondary sources. The various secondary sources used included various company websites, annual reports, trade databases, and paid databases such as Hoover's, Bloomberg Business, Factiva, and Avention. Our team did 45 primary interactions Globally which included several stakeholders such as manufacturers, customers, key opinion leaders, etc. Overall, information procurement was one of the most extensive stages in our research process.
2. Information Analysis: This step involved triangulation of data through bottom-up and top-down approaches to estimate and validate the total size and future estimate of the Barrier-free Facilities Market.
3. Report Formulation: The final step entailed the placement of data points in appropriate Market spaces in an attempt to deduce viable conclusions.
4. Validation & Publishing: Validation is the most important step in the process. Validation & re-validation via an intricately designed process helped us finalize data points to be used for final calculations. The final Market estimates and forecasts were then aligned and sent to our panel of industry experts for validation of data. Once the validation was done the report was sent to our Quality Assurance team to ensure adherence to style guides, consistency & design.
Analyst Support
Customization Options
With the given market data, our dedicated team of analysts can offer you the following customization options are available for the Barrier-free Facilities Market:
Product Analysis: Product matrix, which offers a detailed comparison of the product portfolio of companies.
Regional Analysis: Further analysis of the Barrier-free Facilities Market for additional countries.
Competitive Analysis: Detailed analysis and profiling of additional Market players & comparative analysis of competitive products.
Go to Market Strategy: Find the high-growth channels to invest your marketing efforts and increase your customer base.
Innovation Mapping: Identify racial solutions and innovation, connected to deep ecosystems of innovators, start-ups, academics, and strategic partners.
Category Intelligence: Customized intelligence that is relevant to their supply Markets will enable them to make smarter sourcing decisions and improve their category management.
Public Company Transcript Analysis: To improve the investment performance by generating new alpha and making better-informed decisions.
Social Media Listening: To analyze the conversations and trends happening not just around your brand, but around your industry as a whole, and use those insights to make better Marketing decisions.
REQUEST FOR SAMPLE
 REQUEST FREE CUSTOMIZATION


Want to customize this report? This report can be personalized according to your needs. Our analysts and industry experts will work directly with you to understand your requirements and provide you with customized data in a short amount of time. We offer $1000 worth of FREE customization at the time of purchase.
Feedback From Our Clients


 USA (+1) 351-333-4748

