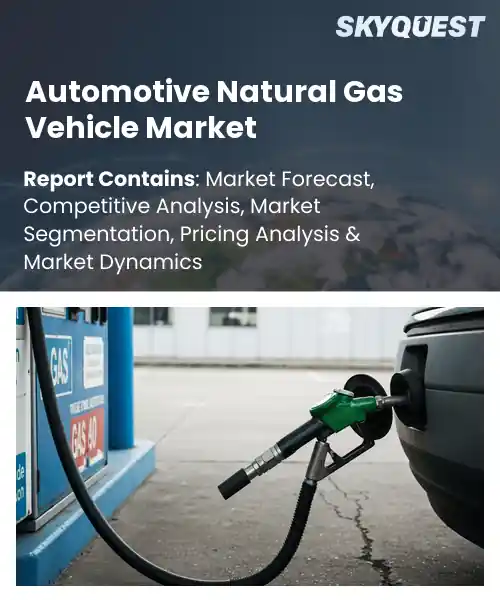
Automotive Natural Gas Vehicle Market
Report ID: SQMIG25C2253
Report ID: SQMIG25C2253
[email protected]
USA +1 351-333-4748
Report ID:
SQMIG25C2253 |
Region:
Global |
Published Date: June, 2026
Pages:
157
|Tables:
115
|Figures:
77


Global Automotive Natural Gas Vehicle Market size was valued at USD 13.52 Billion in 2024 and is poised to grow from USD 14.34 Billion in 2025 to USD 23.0 Billion by 2033, growing at a CAGR of 6.08% during the forecast period (2026-2033).
The primary driver of the automotive natural gas vehicle market is the convergence of energy security concerns and tighter emissions regulations that steer fleets and buyers toward lower carbon alternatives. This market includes passenger autos, buses & light trucks using compressed or liquefied natural gas as fuel, and will ultimately result in cleaner urban air and more fuel diversity due to reduced nitrogen oxide and particulate emissions due to use of CNG. Growth has evolved from being primarily local fleet-based to much larger commercial rollouts, as evidenced by bus conversion projects/initiatives in Bogotá, Colombia, as well as creation of CNG taxi networks in Pakistan. Policy, infrastructure and OEM commitment are key drivers for stimulating growth within this market segment.
A key trend driving the global automotive natural gas vehicles sector is fueling infrastructure and supply chain expansion, because accessible refueling stations and reliable natural gas procurement lower operational risk and shorten payback for fleet operators. Transit agencies are increasingly converting buses to run on compressed natural gas (CNG) or liquefied natural gas (LNG), which results in lower fuel costs, lower maintenance costs, and ultimately generates OEM investments to create dedicated NGV (Natural Gas Vehicle) platforms and certified conversion systems. The potential for additional investments in NGVs increases when renewable natural gas is blended into the fuel stream, or when the fuel stream is comprised completely of renewable natural gas.
How is IoT Optimizing Fleet Management in the Automotive Natural Gas Vehicle Market?
Fleet management for natural gas vehicles is being transformed through the connection of onboard sensors, telematics, and fueling infrastructure as a result of the IoT. Key aspects include real time fuel monitoring, engine diagnostics, route optimization and predictive maintenance. Today fleets use these capabilities to lower unexpected downtime and to coordinate CNG refueling windows. In market context, fleet operators are balancing fuel cost advantages and infrastructure limits, so IoT helps by improving asset utilization and by smoothing operations. Examples include telematics from vehicles that report on fuel usage/the condition of the engine and monitoring from the sites where compressors are used to schedule when to use compressors and notify managers when to service compressors.
In May 2026, Vontier showcased integrated CNG refueling and telematics that link fueling hardware and vehicle data to streamline refueling, improve asset visibility and accelerate maintenance decisions. It reduces downtime and helps managers make informed fuel strategy choices.
Market snapshot - (2026-2033)
Global Market Size
USD 13.52 Billion
Largest Segment
Light-Duty Vehicle
Fastest Growth
High-Duty Vehicle
Growth Rate
6.08% CAGR
To get more insights on this market click here to Request a Free Sample Report
Global automotive natural gas vehicle market is segmented by vehicle type, fuel type, application, sales channel and region. Based on vehicle type, the market is segmented into light-duty vehicle, medium-duty vehicle, high-duty vehicle and others. Based on fuel type, the market is segmented into compressed natural gas (CNG) and liquefied natural gas (LNG). Based on application, the market is segmented into passenger cars and commercial vehicles. Based on sales channel, the market is segmented into OEM and retrofit. Based on region, the market is segmented into North America, Europe, Asia Pacific, Latin America and Middle East & Africa.
As per the global automotive natural gas vehicle market growth, CNG segment dominates because its fueling infrastructure, vehicle compatibility and cost of ownership align with existing fleet needs, making it the default choice for many buyers. Mature supply chains and widespread industry familiarity reduce deployment friction, enabling operators to convert or spec natural gas vehicles with predictable maintenance and operational profiles. This leading to prioritizing them when looking for ways to promote the adoption of CNG through increasing available CNG options and providing support.
However, LNG is emerging as the most rapidly expanding option driven by demand in long haul and heavy duty applications. Advances in cryogenic systems, product availability for heavy vehicles and industry focus on range and performance are prompting pilot deployments and investment, unlocking new commercial opportunities for natural gas mobility.
Retrofit segment dominates because it enables rapid conversion of existing vehicles without the capital intensity of fleet replacement, making natural gas transition accessible to operators seeking immediate fuel cost and emissions benefits. Creating convertor kits to retrofit existing vehicles, training up to 1000 installers per month, using modular solutions to reduce downtime and operational disruption for fleet owners to facilitate targeted strategies on various vehicle types. The practical approach provides a pathway for attracting service networks and financing types, which will further entrench retrofits as a major pathway for adoption.
However, OEM is emerging as the most rapidly expanding avenue as manufacturers integrate factory built natural gas powertrains with warranty and optimized performance. Expanded model availability, engineering integration and coordinated support with fuel providers simplify ownership and compliance, driving commercial acceptance and unlocking scale that positions OEM offerings as a new growth engine.
To get detailed segments analysis, Request a Free Sample Report
As per the global automotive natural gas vehicles market share, Asia Pacific commands the industry through a combination of industrial depth, coordinated policy support, and strong adoption across commercial transport and municipal fleets. Vehicle makers and part supply firms in the region focus on natural gas/energy systems and collaborative resources to connect the auto supply chain, power suppliers and regional/local governments for natural gas refueling infrastructure and refueling systems development, and to combine refuelling infrastructure with natural gas vehicle development projects in order to reduce operational barriers to scaling NGV vehicles. Low-cost manufacturing and export capability to enable the rapid dissemination of NGV components, while the application of sound diversification and fleet conversion strategies fosters a strong competitive environment that bolsters the region's position as leader in the natural gas vehicle market.
Automotive natural gas vehicle market Japan benefits from advanced engineering capabilities, strong OEM interest in alternative powertrains, and integrated supply chains that support system development and deployment. Urban fleet operators are specifically looking to diversify their sources of fuel for their vehicles. The development of compressed gas storage systems and effective combustion tuning will go hand-in-hand with local vehicle design trends, thereby making it easier to adopt these technologies within the commercial and municipal sectors.
Automotive natural gas vehicle market South Korea is characterized by strong collaboration between manufacturers, technology providers, and logistics operators to optimize natural gas drivetrains for light and heavy vehicles. National capacity for innovation and regional supply-chain development is supported by testing through pilots. Pilot programs show the viability of existing businesses using modular fuel systems and connecting those systems to existing business service networks helps fleets adopt new business opportunities for greener, more economical fuels gradually.
Based on global automotive natural gas vehicles regional forecast, Europe is experiencing rapid expansion driven by regulatory focus on cleaner mobility pathways, concentrated industrial expertise, and coordinated infrastructure efforts that support commercial and municipal fleet transitions. Demand for complementary low emission alternatives is driven by fleet modernization priorities, urban emissions reduction, and supporting skilled providers/retrofit specialists implementable throughout the heavy/medium duty market. Cross-sectored collaboration between manufacturers, gas suppliers and public authorities speed standardization and refueling accessibility. Germany serves as a manufacturing/technology hub, with integrated/phased policy frameworks enabling logistics solutions across borders. Investments in workforce skill development and after-market services collectively produce reliable operation of the fleet, contributing to regional leadership among diversified sustainable mobility offerings.
Automotive natural gas vehicle market in Germany anchors regional activity through a combination of manufacturing excellence, supplier networks, and policy alignment that supports fleet adoption. The collaboration between OEMs and system suppliers produces high performance engines and storage systems designed for commercial transportation. Well established logistics corridors combined with cooperative refueling programs help provide operational reliability for urban distribution fleets. Close engagement by industry, the operators of the fleets and the standards industry facilitates retrofit pathways and integrated decarbonization strategies.
Automotive natural gas vehicle market in United Kingdom shows emerging momentum driven by municipal fleet programs and growing interest from commercial operators seeking operational flexibility. The collaboration of local producers, electric companies, and transit authorities has enhanced interoperability and has led to the implementation of user-friendly technologies. There are also opportunities for companies to utilize financial incentive programs or collaborate with other companies to further encourage the use of natural gas to help support the ongoing development of environmentally-friendly technologies.
Automotive natural gas vehicle market in France is experiencing rapid adoption driven by proactive local policy support, strong engagement from municipal administrations, and participation by fleet operators shifting toward lower emission fuels. Urban delivery and conversion of public transport are both important to demonstrate the operational compatibility of these new technologies. Additionally, the effort of various industry stakeholders to standardize component specifications will help facilitate greater acceptance in a broad range of mobility segment markets.
As per global automotive natural gas vehicles regional outlook, North America is strengthening its position through targeted collaboration between vehicle manufacturers, energy companies, and large fleet operators that prioritize operational resilience and fuel diversity. The combination of supplier knowledge for heavy-duty applications and investment in refuelling infrastructure is helping to support the actual deployment of a practical refuelling option in both long-haul and urban delivery networks. Flexibility in assessing the total cost of ownership versus environmental objectives for fleet managers is provided through pathways for retrofitting and original equipment manufacturer (OEM) integration. Standardization; development of safety protocols and workforce training will be facilitated by regional industry associations and pilot programs, providing opportunities for the establishment of reliable service models. End users can build confidence through cross-sector partnerships and successful operational case studies.
Automotive natural gas vehicle market in United States benefits from fleet demand, established gas infrastructure, and active collaboration between OEMs and energy providers to tailor natural gas applications for heavy transport and municipal services. Examples of pilot programs show how logistics operations can have an integrated approach to their supply chain, while aftermarket parts suppliers help to create retrofitting pathways. Focus on safety and reliability standards by the entire transportation industry gives operators confidence. Working together through this collaboration enables the entire transportation industry to find viable options for scaling up.
Automotive natural gas vehicle market in Canada leverages energy sector expertise and regional fuel networks to support natural gas uptake among commercial and municipal fleets. In addition, focusing on retrofitting and providing maintenance support gives operators comfort in knowing they can rely on their equipment. Additionally, working with trade associations / industry groups and fleet owners provides a means for sharing information to facilitate the acceptance and adaption of the technology within different operating environments.
To know more about the market opportunities by region and country, click here to
Buy The Complete Report
Lower Operating Cost Advantage
Growing Environmental Policy Support
Limited Refueling Infrastructure Availability
Higher Upfront Vehicle Costs
Request Free Customization of this report to help us to meet your business objectives.
The competitive landscape for global automotive natural gas vehicles market outlook is shaped by consolidation, fueling network expansion, and powertrain innovation that alter fleet procurement and operating choices. Notable corporate moves include Cummins acquiring a stake in Momentum Fuel Technologies, the Beyond6 joint venture between Chevron and Mercuria to scale CNG stations, and Hyliion’s development of a natural gas range extender for heavy duty trucks.
Top Player’s Company Profile
Recent Developments
SkyQuest’s ABIRAW (Advanced Business Intelligence, Research & Analysis Wing) is our Business Information Services team that Collects, Collates, Correlates, and Analyses the Data collected by means of Primary Exploratory Research backed by robust Secondary Desk research.
As per SkyQuest analysis, the global automotive natural gas vehicle industry is propelled by energy security concerns and tightening emissions regulations, while limited refueling infrastructure remains a significant restraint that slows wider fleet adoption. Asia Pacific leads the market thanks to coordinated policy support, manufacturing depth and active fleet rollouts, and the CNG segment dominates owing to mature supply chains, lower ownership costs and broad vehicle compatibility. A complementary driver is the ongoing expansion of fueling infrastructure and supply chains, which lowers operational risk and shortens payback for fleets. As deployments scale, opportunities from renewable natural gas and OEM integration will further shape adoption and commercial viability.
| Report Metric | Details |
|---|---|
| Market size value in 2024 | USD 13.52 Billion |
| Market size value in 2033 | USD 23.0 Billion |
| Growth Rate | 6.08% |
| Base year | 2024 |
| Forecast period | (2026-2033) |
| Forecast Unit (Value) | USD Billion |
| Segments covered |
|
| Regions covered | North America (US, Canada), Europe (Germany, France, United Kingdom, Italy, Spain, Rest of Europe), Asia Pacific (China, India, Japan, Rest of Asia-Pacific), Latin America (Brazil, Rest of Latin America), Middle East & Africa (South Africa, GCC Countries, Rest of MEA) |
| Companies covered |
|
| Customization scope | Free report customization with purchase. Customization includes:-
|
To get a free trial access to our platform which is a one stop solution for all your data requirements for quicker decision making. This platform allows you to compare markets, competitors who are prominent in the market, and mega trends that are influencing the dynamics in the market. Also, get access to detailed SkyQuest exclusive matrix.
Table Of Content
Executive Summary
Market overview
Parent Market Analysis
Market overview
Market size
KEY MARKET INSIGHTS
COVID IMPACT
MARKET DYNAMICS & OUTLOOK
Market Size by Region
KEY COMPANY PROFILES
Methodology
For the Automotive Natural Gas Vehicle Market, our research methodology involved a mixture of primary and secondary data sources. Key steps involved in the research process are listed below:
1. Information Procurement: This stage involved the procurement of Market data or related information via primary and secondary sources. The various secondary sources used included various company websites, annual reports, trade databases, and paid databases such as Hoover's, Bloomberg Business, Factiva, and Avention. Our team did 45 primary interactions Globally which included several stakeholders such as manufacturers, customers, key opinion leaders, etc. Overall, information procurement was one of the most extensive stages in our research process.
2. Information Analysis: This step involved triangulation of data through bottom-up and top-down approaches to estimate and validate the total size and future estimate of the Automotive Natural Gas Vehicle Market.
3. Report Formulation: The final step entailed the placement of data points in appropriate Market spaces in an attempt to deduce viable conclusions.
4. Validation & Publishing: Validation is the most important step in the process. Validation & re-validation via an intricately designed process helped us finalize data points to be used for final calculations. The final Market estimates and forecasts were then aligned and sent to our panel of industry experts for validation of data. Once the validation was done the report was sent to our Quality Assurance team to ensure adherence to style guides, consistency & design.
Analyst Support
Customization Options
With the given market data, our dedicated team of analysts can offer you the following customization options are available for the Automotive Natural Gas Vehicle Market:
Product Analysis: Product matrix, which offers a detailed comparison of the product portfolio of companies.
Regional Analysis: Further analysis of the Automotive Natural Gas Vehicle Market for additional countries.
Competitive Analysis: Detailed analysis and profiling of additional Market players & comparative analysis of competitive products.
Go to Market Strategy: Find the high-growth channels to invest your marketing efforts and increase your customer base.
Innovation Mapping: Identify racial solutions and innovation, connected to deep ecosystems of innovators, start-ups, academics, and strategic partners.
Category Intelligence: Customized intelligence that is relevant to their supply Markets will enable them to make smarter sourcing decisions and improve their category management.
Public Company Transcript Analysis: To improve the investment performance by generating new alpha and making better-informed decisions.
Social Media Listening: To analyze the conversations and trends happening not just around your brand, but around your industry as a whole, and use those insights to make better Marketing decisions.
REQUEST FOR SAMPLE
 REQUEST FREE CUSTOMIZATION
Global Automotive Natural Gas Vehicle Market size was valued at USD 13.52 Billion in 2024 and is poised to grow from USD 14.34 Billion in 2025 to USD 23.0 Billion by 2033, growing at a CAGR of 6.08% during the forecast period (2026-2033).
The competitive landscape for global automotive natural gas vehicles is shaped by consolidation, fueling network expansion, and powertrain innovation that alter fleet procurement and operating choices. Notable corporate moves include Cummins acquiring a stake in Momentum Fuel Technologies, the Beyond6 joint venture between Chevron and Mercuria to scale CNG stations, and Hyliion’s development of a natural gas range extender for heavy duty trucks. 'Volkswagen Group', 'Stellantis', 'Honda Motor', 'Hyundai Motor Group', 'Toyota Motor', 'Suzuki Motor', 'Iveco Group', 'Tata Motors', 'Mahindra & Mahindra', 'Ford Motor', 'General Motors', 'Renault Group', 'Dongfeng Motor', 'SAIC Motor', 'Cummins', 'Paccar', 'Navistar', 'AB Volvo', 'Daimler Truck', 'Scania'
Lower fuel and maintenance expenses reduce total cost of ownership for operators and private buyers, making natural gas vehicles economically attractive over vehicle lifetimes. Predictable refueling costs allow fleet managers to plan budgets and prioritize NGV procurement, while savings on routine engine maintenance and longer oil change intervals strengthen the business case. These cumulative operational benefits encourage fleet conversions and promote manufacturer offerings tailored to cost-sensitive segments, thereby expanding market demand and incentivizing further investment in supportive infrastructure and services.
Renewable Gas Integration: Growing interest in biomethane and renewable natural gas is reshaping the NGV market as stakeholders pursue lower lifecycle emissions and circular waste-to-energy pathways. OEMs, fuel suppliers and fleet operators are forming partnerships to secure sustainable fuel supplies and certification frameworks. Policy incentives and voluntary corporate procurement create demand for upgraded gas supplies and blending strategies, encouraging investment in biogas upgrading, logistics and long-term contracts. This trend enhances the environmental value proposition of NGVs and unlocks commercial collaborations.
Why does Asia Pacific Dominate the Global Automotive Natural Gas Vehicle Market? |@12


Want to customize this report? This report can be personalized according to your needs. Our analysts and industry experts will work directly with you to understand your requirements and provide you with customized data in a short amount of time. We offer $1000 worth of FREE customization at the time of purchase.
Feedback From Our Clients


 USA (+1) 351-333-4748

