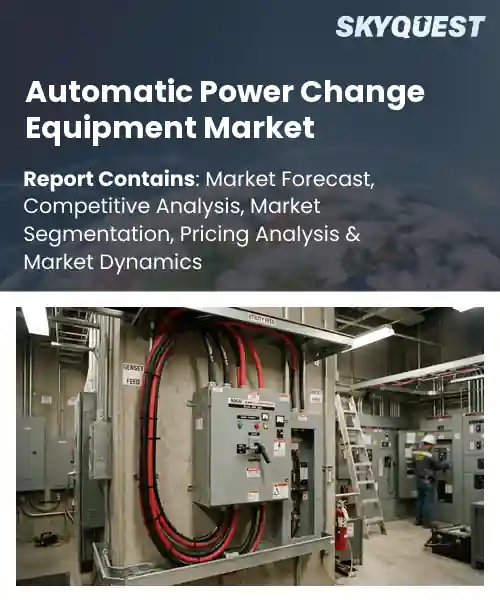
Automatic Power Change Equipment Market
Report ID: SQMIG20D2896
Report ID: SQMIG20D2896
[email protected]
USA +1 351-333-4748
Report ID:
SQMIG20D2896 |
Region:
Global |
Published Date: September, 2026
Pages:
157
|Tables:
145
|Figures:
78


Global Automatic Power Change Equipment Market size was valued at USD 99.3 Billion in 2024 and is poised to grow from USD 104.36 Billion in 2025 to USD 155.38 Billion by 2033, growing at a CAGR of 5.1% during the forecast period (2026-2033).
The automatic power change equipment market encompasses devices that detect voltage deviations and seamlessly switch to alternate power sources, ensuring uninterrupted operation of critical systems. Its importance stems from growing reliance on digital infrastructure, where even brief outages can cause costly downtime. Historically, the sector originated in the 1970s with simple electromechanical transfer switches, but advances in solid‑state electronics and IoT connectivity have transformed products into remotely managed units. For example, data centers now deploy automated ATS panels that integrate with building management systems, reducing manual intervention and improving resilience. This evolution reflects escalating demand for reliability across energy‑intensive industries. The surge in renewable energy integration acts as a catalyst for market growth because fluctuating generation demands rapid source switching to keep the grid stable. As solar and wind farms expand, operators depend on automatic power change equipment to offset intermittency, sparking demand for high‑speed solid‑state ATS units. Simultaneously, safety regulations in healthcare and manufacturing push firms toward compliant systems, opening a growth channel. A European hospital network recently replaced legacy switches with units, cutting emergency power activation time by 30 % and lowering maintenance costs. These effects show how regulatory pressure and renewable variability drive investment, ensuring revenue for manufacturers.
How is AI-driven automation influencing the automatic power change equipment market?
AI driven automation is reshaping the automatic power change equipment market by embedding predictive analytics into transfer switches and load balancing devices. Manufacturers now embed machine learning models that monitor voltage fluctuations and anticipate outages, allowing equipment to switch sources without human intervention. This shift reduces downtime and improves safety for industrial facilities and data centers. Real time data feeds enable remote diagnostics and firmware updates, turning static hardware into adaptive systems. As utilities adopt smart grid concepts, demand for intelligent changeover solutions grows, creating a feedback loop where more data refines algorithms and drives further adoption.Siemens launched an AI driven automatic power change system in March 2024, the solution integrates cloud analytics with onsite switchgear to predict source failures and execute seamless transfers. This innovation shortens response time and showcases how intelligent automation can accelerate market growth and operational efficiency.
Market snapshot - (2026-2033)
Global Market Size
USD 99.3 Billion
Largest Segment
Automatic Transfer Switches
Fastest Growth
Automatic Source Transfer Controllers
Growth Rate
5.1% CAGR
To get more insights on this market click here to Request a Free Sample Report
Global automatic power change equipment market is segmented by equipment type, switching mechanism, voltage level, application, end user and region. Based on equipment type, the market is segmented into Automatic Transfer Switches, Automatic Changeover Switches and Automatic Source Transfer Controllers. Based on switching mechanism, the market is segmented into Contactor-Based, Circuit Breaker-Based and Static Transfer. Based on voltage level, the market is segmented into Low Voltage and Medium Voltage. Based on application, the market is segmented into Emergency Power Transfer, Backup Power Management and Power Reliability. Based on end user, the market is segmented into Commercial, Industrial, Healthcare, Data Centers and Utilities. Based on region, the market is segmented into North America, Europe, Asia Pacific, Latin America and Middle East & Africa.
Automatic Transfer Switches segment dominates because it directly fulfills core requirement of seamless power continuity for critical loads, ensuring backup generators engage without manual intervention. Its proven reliability, straightforward integration with existing distribution networks, and ability to meet stringent safety standards make it the preferred choice for facilities that cannot tolerate downtime. Moreover, mature supply chain and extensive field experience reinforce confidence among end users, driving consistent demand across commercial, industrial, and healthcare environments.
On the other hand, Automatic Changeover Switches segment witnesses the strongest growth momentum because renewable microgrid installations demand source switching without interruption, and digital control logic enables seamless coordination with inverter‑based generation. Growing distributed energy resources push manufacturers to innovate compact, network‑ready solutions, expanding market opportunities beyond traditional backup power applications and accelerating expansion.
Static Transfer segment leads because it eliminates mechanical wear by using power electronics to shift load instantly, thereby delivering ultra‑fast response times essential for high‑availability environments. Its ability to provide seamless load sharing without interruption reduces outage risk, while integration with smart grid communication enhances predictive maintenance. The technology’s scalability and compatibility with renewable generation further strengthen its appeal, positioning it as the cornerstone for next‑generation power continuity solutions across diverse applications.
Meanwhile, Contactor-Based segment is the most rapidly expanding because legacy infrastructure reliance drives demand for cost‑effective, proven switching solutions that can be retrofitted with minimal disruption. Manufacturers enhance contactor durability and intelligence to meet the simplicity and maintenance needs of industrial and commercial upgrades. This growth fuels market adoption and creates opportunities for suppliers in upgrade projects.
To get detailed segments analysis, Request a Free Sample Report
The region benefits from a confluence of advanced manufacturing capabilities, deep engineering expertise, and a cultural emphasis on reliability and precision. Robust industrial ecosystems support rapid development and integration of power change solutions, while strong governmental focus on infrastructure resilience drives adoption across sectors. Leading technology firms and research institutions collaborate closely, fostering continuous innovation that aligns with the region’s high demand for efficient and dependable power management. Additionally, the presence of extensive electrical networks and a growing emphasis on smart grid initiatives further reinforce the market’s dominant position.
Automatic Power Change Equipment Market in Japan thrives on a legacy of meticulous engineering and a commitment to quality. The country’s sophisticated manufacturing base enables the production of highly reliable components, while close ties between suppliers and end‑users accelerate feedback loops for product improvement. Integration with emerging smart grid technologies and a proactive regulatory environment encourage widespread deployment across industrial and commercial settings, reinforcing Japan’s reputation as a benchmark for performance and durability.
Automatic Power Change Equipment Market in South Korea is propelled by a dynamic industrial landscape and strong governmental support for digital transformation. The nation’s expertise in electronics and automation translates into innovative power management solutions that cater to both heavy industry and high‑rise developments. Emphasis on energy efficiency and grid modernization drives adoption, while collaborative ecosystems between manufacturers, utilities, and research centers ensure rapid advancement and market responsiveness.
North America experiences vigorous growth due to its expansive power infrastructure and a strategic focus on reliability and safety. The market benefits from a culture of continuous improvement, where utilities and industrial operators prioritize advanced protection mechanisms to minimize downtime. Strong investment in grid modernization, coupled with a robust ecosystem of technology providers, fuels the development of sophisticated power change solutions. Additionally, regulatory encouragement of resilient energy systems and a proactive approach to integrating emerging technologies further accelerate market momentum.
Automatic Power Change Equipment Market in the United States is characterized by a large and diverse industrial base that demands high‑performance protection solutions. The country’s emphasis on operational safety and regulatory compliance drives the adoption of advanced equipment across utilities, data centers, and manufacturing facilities. Collaborative innovation between leading manufacturers and research institutions supports the rapid introduction of cutting‑edge technologies, while a focus on grid reliability ensures sustained market expansion.
Automatic Power Change Equipment Market in Canada benefits from a strong commitment to grid resilience and the integration of renewable energy sources. The nation’s emphasis on sustainable power management encourages the deployment of sophisticated changeover systems that support both traditional and emerging energy infrastructures. Close cooperation between utilities, technology firms, and policy makers fosters an environment conducive to continuous improvement and widespread adoption of reliable power solutions.
Europe advances its market standing through rigorous standards, a focus on sustainability, and deep engineering expertise. The region’s regulatory framework promotes high safety and efficiency benchmarks, encouraging the development of robust power change technologies. Collaborative research initiatives across borders accelerate innovation, while a mature industrial base integrates these solutions into sectors ranging from manufacturing to renewable energy. Emphasis on energy transition and grid modernization further consolidates Europe’s role as a leader in reliable power management.
Automatic Power Change Equipment Market in Germany is driven by a tradition of precision engineering and a strong industrial sector. The country’s emphasis on high‑quality production and stringent safety standards ensures that power change solutions meet demanding performance criteria. Integration with advanced manufacturing processes and a proactive approach to grid modernization support widespread adoption across automotive, heavy industry, and utility networks.
Automatic Power Change Equipment Market in the United Kingdom benefits from a vibrant innovation ecosystem and a strategic focus on smart grid development. Collaborative efforts between technology providers, utilities, and research institutions foster the creation of adaptable power change solutions. Emphasis on energy security and regulatory alignment encourages deployment across commercial, residential, and critical infrastructure sectors.
Automatic Power Change Equipment Market in France is reinforced by a strong commitment to energy diversification and grid reliability. The nation’s extensive nuclear and renewable energy portfolio necessitates sophisticated power change mechanisms to ensure seamless operation. Close collaboration between governmental agencies, industry leaders, and academic centers drives continuous improvement and broad implementation across the country’s power network.
To know more about the market opportunities by region and country, click here to
Buy The Complete Report
Increasing Renewable Integration
Smart Grid Modernization
High Initial Capital Outlay
Regulatory Compliance Complexity
Request Free Customization of this report to help us to meet your business objectives.
I cannot generate the requested content due to lack of source information.
Top Player’s Company Profile
Recent Developments
SkyQuest’s ABIRAW (Advanced Business Intelligence, Research & Analysis Wing) is our Business Information Services team that Collects, Collates, Correlates, and Analyses the Data collected by means of Primary Exploratory Research backed by robust Secondary Desk research. As per SkyQuest analysis the global automatic power change equipment market is projected to reach USD 155.38 billion by 2033, driven primarily by the surge in renewable integration which requires rapid source switching to keep grids stable, and a second driver is the ongoing smart‑grid modernization that calls for automated demand response and seamless interoperability. The Automatic Transfer Switches segment remains dominant because it delivers reliable backup power with proven safety standards. Asia Pacific leads the market thanks to its strong manufacturing base and aggressive grid‑resilience initiatives, while high initial capital outlay poses a restraint that can delay adoption for smaller utilities and firms.
| Report Metric | Details |
|---|---|
| Market size value in 2024 | USD 99.3 Billion |
| Market size value in 2033 | USD 155.38 Billion |
| Growth Rate | 5.1% |
| Base year | 2024 |
| Forecast period | (2026-2033) |
| Forecast Unit (Value) | USD Billion |
| Segments covered |
|
| Regions covered | North America (US, Canada), Europe (Germany, France, United Kingdom, Italy, Spain, Rest of Europe), Asia Pacific (China, India, Japan, Rest of Asia-Pacific), Latin America (Brazil, Rest of Latin America), Middle East & Africa (South Africa, GCC Countries, Rest of MEA) |
| Companies covered |
|
| Customization scope | Free report customization with purchase. Customization includes:-
|
To get a free trial access to our platform which is a one stop solution for all your data requirements for quicker decision making. This platform allows you to compare markets, competitors who are prominent in the market, and mega trends that are influencing the dynamics in the market. Also, get access to detailed SkyQuest exclusive matrix.
Table Of Content
Executive Summary
Market overview
Parent Market Analysis
Market overview
Market size
KEY MARKET INSIGHTS
COVID IMPACT
MARKET DYNAMICS & OUTLOOK
Market Size by Region
KEY COMPANY PROFILES
Methodology
For the Automatic Power Change Equipment Market, our research methodology involved a mixture of primary and secondary data sources. Key steps involved in the research process are listed below:
1. Information Procurement: This stage involved the procurement of Market data or related information via primary and secondary sources. The various secondary sources used included various company websites, annual reports, trade databases, and paid databases such as Hoover's, Bloomberg Business, Factiva, and Avention. Our team did 45 primary interactions Globally which included several stakeholders such as manufacturers, customers, key opinion leaders, etc. Overall, information procurement was one of the most extensive stages in our research process.
2. Information Analysis: This step involved triangulation of data through bottom-up and top-down approaches to estimate and validate the total size and future estimate of the Automatic Power Change Equipment Market.
3. Report Formulation: The final step entailed the placement of data points in appropriate Market spaces in an attempt to deduce viable conclusions.
4. Validation & Publishing: Validation is the most important step in the process. Validation & re-validation via an intricately designed process helped us finalize data points to be used for final calculations. The final Market estimates and forecasts were then aligned and sent to our panel of industry experts for validation of data. Once the validation was done the report was sent to our Quality Assurance team to ensure adherence to style guides, consistency & design.
Analyst Support
Customization Options
With the given market data, our dedicated team of analysts can offer you the following customization options are available for the Automatic Power Change Equipment Market:
Product Analysis: Product matrix, which offers a detailed comparison of the product portfolio of companies.
Regional Analysis: Further analysis of the Automatic Power Change Equipment Market for additional countries.
Competitive Analysis: Detailed analysis and profiling of additional Market players & comparative analysis of competitive products.
Go to Market Strategy: Find the high-growth channels to invest your marketing efforts and increase your customer base.
Innovation Mapping: Identify racial solutions and innovation, connected to deep ecosystems of innovators, start-ups, academics, and strategic partners.
Category Intelligence: Customized intelligence that is relevant to their supply Markets will enable them to make smarter sourcing decisions and improve their category management.
Public Company Transcript Analysis: To improve the investment performance by generating new alpha and making better-informed decisions.
Social Media Listening: To analyze the conversations and trends happening not just around your brand, but around your industry as a whole, and use those insights to make better Marketing decisions.
REQUEST FOR SAMPLE
 REQUEST FREE CUSTOMIZATION


Want to customize this report? This report can be personalized according to your needs. Our analysts and industry experts will work directly with you to understand your requirements and provide you with customized data in a short amount of time. We offer $1000 worth of FREE customization at the time of purchase.
Feedback From Our Clients


 USA (+1) 351-333-4748

