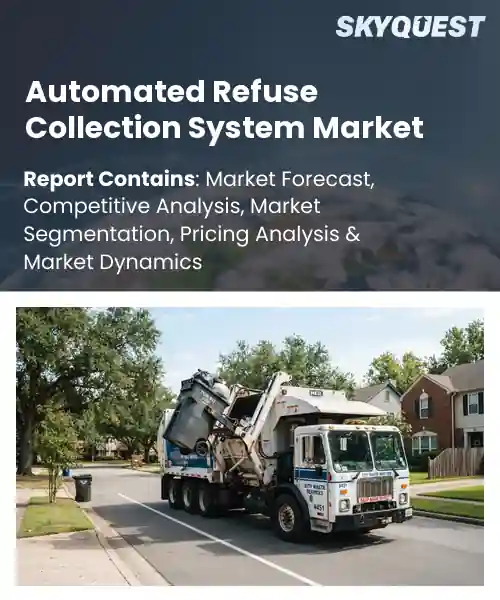
Automated Refuse Collection System Market
Report ID: SQMIG20L2120
Report ID: SQMIG20L2120
[email protected]
USA +1 351-333-4748
Report ID:
SQMIG20L2120 |
Region:
Global |
Published Date: August, 2026
Pages:
157
|Tables:
118
|Figures:
77


Global Automated Refuse Collection System Market size was valued at USD 3.89 Billion in 2024 and is poised to grow from USD 4.32 Billion in 2025 to USD 10.04 Billion by 2033, growing at a CAGR of 11.1% during the forecast period (2026-2033).
The automated refuse collection system market encompasses hardware, software, and service solutions that replace manual garbage pickup with containers, robotic arms, and platforms. Its relevance stems from urban density, rising labor costs, and stricter environmental regulations that demand efficient waste handling. Historically the sector emerged in the early 2000s with pilot projects in Stockholm and Seoul, where RFID‑tagged bins transmitted fill levels to municipal fleets, cutting collection trips by 30 %. Over the past decade, advances in IoT connectivity and AI route optimization have transformed these pilots into deployments across Europe, North America and parts of Asia, establishing a growth trajectory. Demand for real‑time data analytics stands as the compelling catalyst for the global automated refuse collection system market, because municipalities seek to reduce fuel consumption while meeting zero‑waste targets. When sensors report bin fill percentages, central software recalculates routes, eliminating empty runs and cutting emissions by up to 25 % in cities like Copenhagen. This efficiency gain encourages public‑private partnerships that fund retrofitting of legacy fleets with telematics, creating a revenue stream for equipment manufacturers. Simultaneously, the rise of smart‑city initiatives expands opportunities for integration with renewable‑energy‑powered collection vehicles, allowing waste operators to lower operating costs and comply with carbon‑pricing regimes.
How are AI and IoT enhancing efficiency in the automated refuse collection system market?
AI and IoT are reshaping automated refuse collection by linking sensors, analytics and autonomous vehicles into a seamless network. Smart bins equipped with IoT devices continuously report fill levels, allowing central platforms to predict when each container needs service. AI algorithms process this data to generate dynamic collection routes that avoid empty runs and reduce fuel consumption. The same intelligence monitors motor health and hydraulic systems, flagging maintenance needs before breakdowns occur. Together, these technologies create a feedback loop that improves scheduling accuracy, lowers operational costs and enhances overall service reliability, positioning the market for steady expansion as cities seek smarter waste solutions.In March 2025 Sarasota County introduced an AI‑driven smart bin initiative, demonstrating how real‑time data and automated routing can cut collection cycles and support the market’s growth.
Market snapshot - (2026-2033)
Global Market Size
USD 3.89 Billion
Largest Segment
Stationary Vacuum System
Fastest Growth
Mobile Vacuum System
Growth Rate
11.1% CAGR
To get more insights on this market click here to Request a Free Sample Report
Global automated refuse collection system market is segmented by system type, waste type, application, end user and region. Based on system type, the market is segmented into Stationary Vacuum System and Mobile Vacuum System. Based on waste type, the market is segmented into Municipal Solid Waste, Recyclable Waste, Organic Waste and Medical Waste. Based on application, the market is segmented into Residential, Commercial, Healthcare and Airports & Transportation Hubs. Based on end user, the market is segmented into Municipalities, Private Waste Management Companies and Real Estate Developers. Based on region, the market is segmented into North America, Europe, Asia Pacific, Latin America and Middle East & Africa.
Stationary vacuum system segment dominates because it offers continuous, high‑capacity suction that integrates seamlessly with fixed collection pipelines, delivering consistent performance in dense urban environments. Its ability to minimize manual handling reduces labor exposure and operational costs, while the centralized infrastructure supports reliable power and maintenance regimes. Consequently, operators prioritize this technology for its scalability, durability, and predictable service quality, establishing it as the market’s preferred choice.
Meanwhile, mobile vacuum system segment emerges as the fastest growing because its flexible deployment can serve dispersed locations, temporary events, and retrofitted sites without extensive pipe networks. This adaptability accelerates adoption across emerging smart‑city projects, fostering rapid market expansion and creating new revenue streams for solution providers.
Municipal solid waste segment dominates because it represents the primary volume that city collection networks must manage, compelling operators to seek robust, high‑throughput solutions. The widespread generation of everyday refuse drives demand for reliable automation that reduces street litter, enhances sanitation, and aligns with sustainability mandates. These pressures prioritize technologies capable of handling mixed waste streams efficiently, cementing municipal solid waste as the central focus of market development.
On the other hand, organic waste segment is witnessing the strongest growth because integrated composting and anaerobic digestion modules are being embedded within collection units, turning waste into resource streams. This functional convergence attracts municipalities seeking circular‑economy solutions, propelling rapid uptake and expanding market opportunities for innovative system designs.
To get detailed segments analysis, Request a Free Sample Report
North America benefits from a confluence of mature waste management frameworks, substantial municipal investment, and a culture that embraces technological innovation. The region’s cities prioritize efficiency and sustainability, driving demand for automated collection solutions that reduce labor intensity and improve route optimization. Strong collaboration between public authorities and leading technology providers accelerates product development and deployment. Regulatory environments encourage adoption of smart infrastructure, while consumer awareness of environmental impact fuels support for advanced refuse handling. Together, these factors create a robust ecosystem that sustains market leadership and continuous advancement.
United States Automated Refuse Collection System Market
Automated Refuse Collection System Market in the United States reflects a highly developed landscape where urban centers lead adoption. Municipalities partner closely with technology firms to integrate data‑driven routing and sensor‑based bins, aiming to cut operational costs and enhance service reliability. Policy frameworks promote sustainability, encouraging municipalities to replace conventional collection with automated alternatives. Public acceptance is strong, driven by visible environmental benefits and improved cleanliness. Continuous innovation, supported by research institutions and private capital, sustains a dynamic market that expands across both large metros and emerging suburban areas.
Canada Automated Refuse Collection System Market
Automated Refuse Collection System Market in Canada is shaped by progressive waste policies and a national emphasis on circular economy principles. Major cities pilot automated collection pilots that integrate with smart city platforms, leveraging real‑time data to refine collection schedules. Government incentives and collaborative research initiatives with universities foster technology adaptation tailored to local climate and geography. Stakeholders focus on reducing landfill dependency and enhancing recycling rates, positioning automated solutions as a cornerstone of sustainable urban waste management. The market trajectory reflects growing confidence in technology‑enabled efficiency gains.
Europe’s expansion is propelled by stringent environmental directives, substantial public funding for green infrastructure, and densely populated urban environments that demand efficient waste handling. Cross‑border collaboration among research hubs accelerates innovation, while municipalities adopt automated systems to meet ambitious recycling and waste‑reduction targets. The region’s strong manufacturing base supplies advanced equipment, and public awareness of sustainability fuels acceptance of new technologies. Integration with smart city initiatives and data analytics enhances operational transparency, reinforcing the market’s momentum across diverse European economies.
Germany Automated Refuse Collection System Market
Automated Refuse Collection System Market in Germany stands as a benchmark for mature adoption, underpinned by a robust manufacturing sector and comprehensive policy support. Cities implement automated fleets that synchronize with waste‑to‑energy facilities, optimizing material flow and reducing emissions. The market benefits from strong engineering expertise, enabling customized solutions for varied urban layouts. Public commitment to environmental stewardship drives acceptance, while continuous R&D ensures that technology remains at the forefront of efficiency and reliability.
United Kingdom Automated Refuse Collection System Market
Automated Refuse Collection System Market in the United Kingdom is experiencing swift growth as municipalities pursue aggressive waste reduction goals. Pilot projects in several cities showcase the benefits of sensor‑enabled bins and dynamic routing, attracting private investment and fostering public‑private partnerships. Government initiatives prioritize digital transformation of waste services, encouraging integration with broader smart city frameworks. Consumer enthusiasm for cleaner streets and reduced traffic congestion further accelerates adoption, positioning the United Kingdom as a leading growth market within Europe.
France Automated Refuse Collection System Market
Automated Refuse Collection System Market in France is emerging as a promising segment, driven by supportive national policies that encourage modern waste solutions. Early deployments focus on major urban areas where congestion and environmental concerns are most acute. Collaborative efforts between municipal authorities and technology providers aim to tailor systems to local recycling practices. Growing public interest in sustainable living reinforces market confidence, while ongoing pilot programs lay the groundwork for broader national rollout.
Asia Pacific is advancing its position through rapid urbanization, government‑led smart city agendas, and escalating waste generation that necessitates efficient handling. Nations invest heavily in automation to alleviate labor constraints and improve collection precision, often leveraging indigenous technology expertise. Public‑private collaborations accelerate deployment of sensor‑rich bins and AI‑driven routing platforms. Regional focus on cost‑effective, scalable solutions aligns with diverse city sizes, while environmental awareness drives policy support for automated systems. This synergistic environment propels the region toward greater market prominence.
Japan Automated Refuse Collection System Market
Automated Refuse Collection System Market in Japan benefits from a tradition of robotics and precision engineering, enabling sophisticated automated fleets that integrate seamlessly with existing waste segregation practices. Government programs promote the adoption of sensor‑based collection points, enhancing route efficiency and reducing emissions. Collaboration between municipal bodies and leading technology firms yields customized solutions that address Japan’s unique urban density and aging population challenges. The market’s evolution reflects a commitment to high‑tech, environmentally responsible waste management.
South Korea Automated Refuse Collection System Market
Automated Refuse Collection System Market in South Korea is bolstered by a vibrant tech ecosystem and proactive smart city initiatives. Municipalities partner with domestic innovators to deploy automated bins equipped with real‑time monitoring, facilitating dynamic scheduling and resource optimization. Public‑private partnerships emphasize sustainability, aiming to lower landfill reliance and improve recycling outcomes. The market’s growth is driven by strong governmental support, consumer openness to technology, and a focus on scalable solutions that can be adapted across both megacities and smaller municipalities.
To know more about the market opportunities by region and country, click here to
Buy The Complete Report
Urban Population Growth Drives Demand
Smart City Initiatives Accelerate Adoption
High Initial Capital Investment
Regulatory Compliance Complexity
Request Free Customization of this report to help us to meet your business objectives.
The market is shaped by intense competition as incumbents and newcomers race to secure municipal contracts and expand service territories. Recent M&A activity, such as the acquisition of a regional smart‑bin provider by a leading waste‑equipment manufacturer, illustrates consolidation aimed at integrating sensor‑based routing technology. Partnerships between technology firms and city governments are accelerating the rollout of AI‑driven collection fleets, while firms are differentiating through patented pneumatic lift mechanisms and cloud‑based route optimization platforms.
Top Player’s Company Profile
Recent Developments
SkyQuest’s ABIRAW (Advanced Business Intelligence, Research & Analysis Wing) is our Business Information Services team that Collects, Collates, Correlates, and Analyses the Data collected by means of Primary Exploratory Research backed by robust Secondary Desk research. As per SkyQuest analysis, the global automated refuse collection system market is expanding rapidly, propelled primarily by urban population growth that pressures municipalities to adopt sensor‑driven waste solutions, while smart sensor integration further accelerates adoption by cutting fuel use and improving service reliability. The stationary vacuum system remains the dominant segment thanks to its high‑capacity, continuous suction that fits dense city infrastructure. North America continues to lead the market, benefiting from mature waste frameworks and strong public‑private collaboration. However, the high initial capital investment required for specialized infrastructure poses a significant restraint, often slowing rollout in budget‑constrained jurisdictions. These systems also help cities meet carbon‑reduction targets and enhance public health.
| Report Metric | Details |
|---|---|
| Market size value in 2024 | USD 3.89 Billion |
| Market size value in 2033 | USD 10.04 Billion |
| Growth Rate | 11.1% |
| Base year | 2024 |
| Forecast period | (2026-2033) |
| Forecast Unit (Value) | USD Billion |
| Segments covered |
|
| Regions covered | North America (US, Canada), Europe (Germany, France, United Kingdom, Italy, Spain, Rest of Europe), Asia Pacific (China, India, Japan, Rest of Asia-Pacific), Latin America (Brazil, Rest of Latin America), Middle East & Africa (South Africa, GCC Countries, Rest of MEA) |
| Companies covered |
|
| Customization scope | Free report customization with purchase. Customization includes:-
|
To get a free trial access to our platform which is a one stop solution for all your data requirements for quicker decision making. This platform allows you to compare markets, competitors who are prominent in the market, and mega trends that are influencing the dynamics in the market. Also, get access to detailed SkyQuest exclusive matrix.
Table Of Content
Executive Summary
Market overview
Parent Market Analysis
Market overview
Market size
KEY MARKET INSIGHTS
COVID IMPACT
MARKET DYNAMICS & OUTLOOK
Market Size by Region
KEY COMPANY PROFILES
Methodology
For the Automated Refuse Collection System Market, our research methodology involved a mixture of primary and secondary data sources. Key steps involved in the research process are listed below:
1. Information Procurement: This stage involved the procurement of Market data or related information via primary and secondary sources. The various secondary sources used included various company websites, annual reports, trade databases, and paid databases such as Hoover's, Bloomberg Business, Factiva, and Avention. Our team did 45 primary interactions Globally which included several stakeholders such as manufacturers, customers, key opinion leaders, etc. Overall, information procurement was one of the most extensive stages in our research process.
2. Information Analysis: This step involved triangulation of data through bottom-up and top-down approaches to estimate and validate the total size and future estimate of the Automated Refuse Collection System Market.
3. Report Formulation: The final step entailed the placement of data points in appropriate Market spaces in an attempt to deduce viable conclusions.
4. Validation & Publishing: Validation is the most important step in the process. Validation & re-validation via an intricately designed process helped us finalize data points to be used for final calculations. The final Market estimates and forecasts were then aligned and sent to our panel of industry experts for validation of data. Once the validation was done the report was sent to our Quality Assurance team to ensure adherence to style guides, consistency & design.
Analyst Support
Customization Options
With the given market data, our dedicated team of analysts can offer you the following customization options are available for the Automated Refuse Collection System Market:
Product Analysis: Product matrix, which offers a detailed comparison of the product portfolio of companies.
Regional Analysis: Further analysis of the Automated Refuse Collection System Market for additional countries.
Competitive Analysis: Detailed analysis and profiling of additional Market players & comparative analysis of competitive products.
Go to Market Strategy: Find the high-growth channels to invest your marketing efforts and increase your customer base.
Innovation Mapping: Identify racial solutions and innovation, connected to deep ecosystems of innovators, start-ups, academics, and strategic partners.
Category Intelligence: Customized intelligence that is relevant to their supply Markets will enable them to make smarter sourcing decisions and improve their category management.
Public Company Transcript Analysis: To improve the investment performance by generating new alpha and making better-informed decisions.
Social Media Listening: To analyze the conversations and trends happening not just around your brand, but around your industry as a whole, and use those insights to make better Marketing decisions.
REQUEST FOR SAMPLE
 REQUEST FREE CUSTOMIZATION


Want to customize this report? This report can be personalized according to your needs. Our analysts and industry experts will work directly with you to understand your requirements and provide you with customized data in a short amount of time. We offer $1000 worth of FREE customization at the time of purchase.
Feedback From Our Clients


 USA (+1) 351-333-4748

