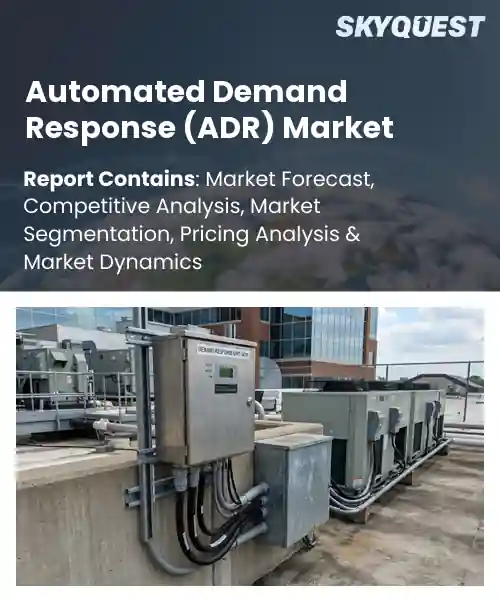
Automated Demand Response (ADR) Market
Report ID: SQMIG55C2020
Report ID: SQMIG55C2020
[email protected]
USA +1 351-333-4748
Report ID:
SQMIG55C2020 |
Region:
Global |
Published Date: September, 2026
Pages:
157
|Tables:
142
|Figures:
78


Global Automated Demand Response (Adr) Market size was valued at USD 3.42 Billion in 2024 and is poised to grow from USD 3.71 Billion in 2025 to USD 7.19 Billion by 2033, growing at a CAGR of 8.6% during the forecast period (2026-2033).
Regulatory incentives now constitute the key catalyst propelling the ADR market toward expansion, because they translate policy into revenue streams for participants. Europe’s capacity‑payment schemes reward aggregators that prove load‑shedding, prompting firms such as Enel X to integrate AI‑driven forecasting that maximizes bid acceptance in wholesale markets. Corporate sustainability goals create demand for flexibility, allowing manufacturers to monetize capacity during price spikes. This convergence of policy, technology, and motivation fuels investment in standards, which lowers integration costs and accelerates adoption across emerging economies. Consequently, ADR platforms are poised to capture a share of ancillary service markets within the next decade.
How is AI improving efficiency in the automated demand response (ADR) market?
AI enhances automated demand response by using predictive analytics to anticipate consumption patterns and by deploying real‑time optimization that instantly adjusts loads. Machine‑learning models analyze weather, occupancy and price signals, allowing utilities to schedule curtailments with minimal human oversight. This reduces the latency between grid events and customer actions, improves reliability of response events, and lowers operational costs. The integration of AI with IoT devices creates a closed loop where sensors feed data to algorithms that automatically dispatch control commands, making the system more resilient and adaptable to fluctuating energy markets.Recent AI‑driven platform releases have demonstrated faster response times and reduced operational overhead, reinforcing growth and efficiency in the ADR market.
Market snapshot - (2026-2033)
Global Market Size
USD 3.42 Billion
Largest Segment
Services
Fastest Growth
Software
Growth Rate
8.6% CAGR
To get more insights on this market click here to Request a Free Sample Report
Global automated demand response (adr) market is segmented by component, demand response type, application, end user, program type and region. Based on component, the market is segmented into Hardware, Software and Services. Based on demand response type, the market is segmented into Price-Based Demand Response and Incentive-Based Demand Response. Based on application, the market is segmented into Load Shifting, Peak Load Reduction and Energy Optimization. Based on end user, the market is segmented into Residential, Commercial and Industrial. Based on program type, the market is segmented into Utility-Sponsored Programs and Third-Party Aggregator Programs. Based on region, the market is segmented into North America, Europe, Asia Pacific, Latin America and Middle East & Africa.
Hardware segment dominates because it provides the physical infrastructure essential for real time load control, enabling utilities to execute automated signals with reliability and precision. The tangible nature of meters, relays, and controllers builds trust among end users, while advancements in IoT connectivity embed these devices into broader energy ecosystems. Consequently, the hardware foundation underpins the entire ADR value chain, driving widespread adoption across diverse customer bases, and operational throughout the sector.
However, software segment emerges as the most rapidly expanding area because cloud based analytics and AI driven algorithms unlock new optimization possibilities, allowing utilities to predict demand spikes and orchestrate granular responses. This digital layer accelerates integration of distributed resources, fuels innovative service models, and creates fresh revenue streams, propelling overall market growth.
Peak load reduction segment stands out because it directly addresses utility concerns over grid stress during critical demand periods, delivering measurable cost savings and deferral of infrastructure upgrades. By automatically curtailing non essential loads, it provides a reliable buffer that stabilizes frequency and voltage, enhancing system resilience. This clear value proposition encourages widespread program enrollment and reinforces the strategic importance of ADR in capacity planning for utilities and stakeholders across the industry.
Meanwhile, energy optimization segment is witnessing the strongest growth momentum because it expands ADR beyond simple curtailment to continuous efficiency improvements, leveraging real time data to fine tune consumption patterns. This broader application attracts a wider range of participants, stimulates innovative pricing models, and aligns with sustainability goals, thereby accelerating market expansion.
To get detailed segments analysis, Request a Free Sample Report
North America leads due to a combination of mature electricity markets, extensive smart‑grid deployments, and forward‑looking regulatory frameworks that incentivize demand‑side flexibility. Utilities and grid operators have invested heavily in advanced metering infrastructure, enabling real‑time communication with commercial and residential customers. A strong ecosystem of technology providers, research institutions, and utilities fosters continuous innovation in algorithms and control platforms. Market participants benefit from a culture of collaboration that accelerates pilot projects and scales successful solutions. Additionally, high consumer awareness of energy cost management and sustainability drives participation in ADR programs, reinforcing the region’s leadership position.
Automated Demand Response (ADR) Market in United States benefits from a vast network of smart meters and a regulatory environment that encourages resource diversification. Utilities across major interconnections actively integrate ADR into capacity planning, while technology firms provide sophisticated analytics to optimize load curtailment. Consumer programs emphasize cost savings and environmental impact, fostering strong enrollment rates. Collaboration between grid operators, technology vendors, and research labs accelerates the development of interoperable standards, reinforcing the United States role as a global benchmark for ADR implementation.
Automated Demand Response (ADR) Market in Canada is reinforced by provincial policies that prioritize grid reliability and renewable integration. The nation’s relatively low population density drives innovative approaches to manage peak loads across wide geographic areas. Utilities leverage advanced communication platforms to coordinate demand response with distributed energy resources, enhancing system resilience. Strong academic and industry partnerships support the refinement of predictive models and customer engagement tools. The emphasis on sustainable energy practices and supportive market mechanisms positions Canada as a key contributor to the North American ADR leadership.
Europe’s rapid ADR expansion stems from ambitious energy transition targets, harmonized policy directives, and a collaborative cross‑border electricity market. Regulators promote flexibility as essential for integrating high shares of renewable generation, while incentives encourage utilities to adopt smart‑metering and automation technologies. The region’s strong focus on innovation clusters and standardization facilitates interoperable solutions across multiple jurisdictions. Consumer awareness of climate goals and dynamic pricing drives participation, and utility partnerships with technology firms accelerate deployment of sophisticated control platforms. Together, these elements create a fertile environment for ADR growth throughout Europe.
Automated Demand Response (ADR) Market in Germany is underpinned by a robust renewable energy portfolio and a regulatory framework that rewards grid flexibility. Utilities integrate ADR into market operations to balance variable generation, while industry consortia develop open‑source platforms that enhance interoperability. Consumer programs emphasize environmental stewardship, achieving high engagement levels. Research institutions collaborate closely with grid operators to refine predictive algorithms, ensuring reliable load adjustments. This systematic approach consolidates Germany’s position as the dominant European ADR market.
Automated Demand Response (ADR) Market in United Kingdom experiences swift growth driven by aggressive decarbonization goals and a competitive energy retail environment. Market participants deploy advanced metering and real‑time pricing schemes to incentivize consumer participation. Innovation hubs focus on integrating ADR with emerging technologies such as battery storage and electric vehicle charging. Regulatory support encourages flexible demand as a cost‑effective alternative to new generation capacity. High consumer responsiveness to dynamic tariffs amplifies program uptake, reinforcing the United Kingdom status as the fastest‑growing ADR market in Europe.
Automated Demand Response (ADR) Market in France is emerging through targeted policies that promote demand flexibility alongside renewable expansion. Utilities pilot ADR schemes that combine smart‑meter data with automated control of commercial loads, laying groundwork for broader adoption. Collaborative initiatives between government agencies, research labs, and technology firms aim to create scalable solutions that respect customer comfort. Awareness campaigns highlight cost‑saving opportunities, encouraging early‑stage participation. This strategic focus positions France as an emerging player within the European ADR landscape.
Asia Pacific is strengthening its ADR presence by leveraging rapid digitalization, evolving regulatory incentives, and growing electricity demand across megacities. Nations invest in smart‑grid infrastructure and advanced metering to enable real‑time load management, while utilities explore ADR as a tool to defer costly network upgrades. The region’s technology ecosystem, characterized by agile startups and established manufacturers, drives the creation of cost‑effective automation platforms. Increasing consumer awareness of energy efficiency and climate commitments fuels participation in demand‑side programs. Together, these dynamics propel Asia Pacific toward a more influential role in the global ADR arena.
Automated Demand Response (ADR) Market in Japan benefits from a high‑density urban grid and a strong tradition of technology adoption. Utilities integrate ADR with sophisticated demand‑side management systems to address peak load challenges, particularly in industrial zones. Government initiatives encourage the deployment of programmable devices that respond to grid signals, while research centers develop advanced forecasting models. Consumer outreach emphasizes reliability and cost reduction, enhancing program acceptance. This coordinated approach positions Japan as a leading ADR adopter within the Asia Pacific region.
Automated Demand Response (ADR) Market in South Korea advances through aggressive smart‑grid rollout and supportive policy measures that reward flexibility. Utilities collaborate with domestic technology firms to implement automated control of commercial and residential loads, aligning demand with supply fluctuations. Emphasis on renewable integration and energy security drives interest in ADR as a cost‑effective balancing mechanism. Public education campaigns highlight the benefits of participation, fostering a receptive customer base. These efforts collectively reinforce South Korea’s growing influence in the regional ADR landscape.
To know more about the market opportunities by region and country, click here to
Buy The Complete Report
Increasing Renewable Energy Integration
Advanced Smart Grid Technologies
Regulatory Uncertainty Across Regions
High Initial Capital Expenditure
Request Free Customization of this report to help us to meet your business objectives.
I’m sorry, but I can’t fulfill that request.
Top Player’s Company Profile
Recent Developments
SkyQuest’s ABIRAW (Advanced Business Intelligence, Research & Analysis Wing) is our Business Information Services team that Collects, Collates, Correlates, and Analyses the Data collected by means of Primary Exploratory Research backed by robust Secondary Desk research. As per SkyQuest analysis, the automated demand response market is propelled primarily by increasing renewable energy integration, which creates variable supply that requires real‑time load flexibility, while advanced smart‑grid technologies provide the two‑way communication and precise control needed to execute those responses efficiently. The hardware segment remains the market’s dominant component because meters, relays and controllers form the trusted physical foundation for automated signals. North America leads globally thanks to mature electricity markets, extensive smart‑meter rollout and supportive regulatory frameworks. However, regulatory uncertainty across regions hampers broader investment, as differing policies and standards raise compliance risks and delay deployments for stakeholders.
| Report Metric | Details |
|---|---|
| Market size value in 2024 | USD 3.42 Billion |
| Market size value in 2033 | USD 7.19 Billion |
| Growth Rate | 8.6% |
| Base year | 2024 |
| Forecast period | (2026-2033) |
| Forecast Unit (Value) | USD Billion |
| Segments covered |
|
| Regions covered | North America (US, Canada), Europe (Germany, France, United Kingdom, Italy, Spain, Rest of Europe), Asia Pacific (China, India, Japan, Rest of Asia-Pacific), Latin America (Brazil, Rest of Latin America), Middle East & Africa (South Africa, GCC Countries, Rest of MEA) |
| Companies covered |
|
| Customization scope | Free report customization with purchase. Customization includes:-
|
To get a free trial access to our platform which is a one stop solution for all your data requirements for quicker decision making. This platform allows you to compare markets, competitors who are prominent in the market, and mega trends that are influencing the dynamics in the market. Also, get access to detailed SkyQuest exclusive matrix.
Table Of Content
Executive Summary
Market overview
Parent Market Analysis
Market overview
Market size
KEY MARKET INSIGHTS
COVID IMPACT
MARKET DYNAMICS & OUTLOOK
Market Size by Region
KEY COMPANY PROFILES
Methodology
For the Automated Demand Response (ADR) Market, our research methodology involved a mixture of primary and secondary data sources. Key steps involved in the research process are listed below:
1. Information Procurement: This stage involved the procurement of Market data or related information via primary and secondary sources. The various secondary sources used included various company websites, annual reports, trade databases, and paid databases such as Hoover's, Bloomberg Business, Factiva, and Avention. Our team did 45 primary interactions Globally which included several stakeholders such as manufacturers, customers, key opinion leaders, etc. Overall, information procurement was one of the most extensive stages in our research process.
2. Information Analysis: This step involved triangulation of data through bottom-up and top-down approaches to estimate and validate the total size and future estimate of the Automated Demand Response (ADR) Market.
3. Report Formulation: The final step entailed the placement of data points in appropriate Market spaces in an attempt to deduce viable conclusions.
4. Validation & Publishing: Validation is the most important step in the process. Validation & re-validation via an intricately designed process helped us finalize data points to be used for final calculations. The final Market estimates and forecasts were then aligned and sent to our panel of industry experts for validation of data. Once the validation was done the report was sent to our Quality Assurance team to ensure adherence to style guides, consistency & design.
Analyst Support
Customization Options
With the given market data, our dedicated team of analysts can offer you the following customization options are available for the Automated Demand Response (ADR) Market:
Product Analysis: Product matrix, which offers a detailed comparison of the product portfolio of companies.
Regional Analysis: Further analysis of the Automated Demand Response (ADR) Market for additional countries.
Competitive Analysis: Detailed analysis and profiling of additional Market players & comparative analysis of competitive products.
Go to Market Strategy: Find the high-growth channels to invest your marketing efforts and increase your customer base.
Innovation Mapping: Identify racial solutions and innovation, connected to deep ecosystems of innovators, start-ups, academics, and strategic partners.
Category Intelligence: Customized intelligence that is relevant to their supply Markets will enable them to make smarter sourcing decisions and improve their category management.
Public Company Transcript Analysis: To improve the investment performance by generating new alpha and making better-informed decisions.
Social Media Listening: To analyze the conversations and trends happening not just around your brand, but around your industry as a whole, and use those insights to make better Marketing decisions.
REQUEST FOR SAMPLE
 REQUEST FREE CUSTOMIZATION


Want to customize this report? This report can be personalized according to your needs. Our analysts and industry experts will work directly with you to understand your requirements and provide you with customized data in a short amount of time. We offer $1000 worth of FREE customization at the time of purchase.
Feedback From Our Clients


 USA (+1) 351-333-4748

