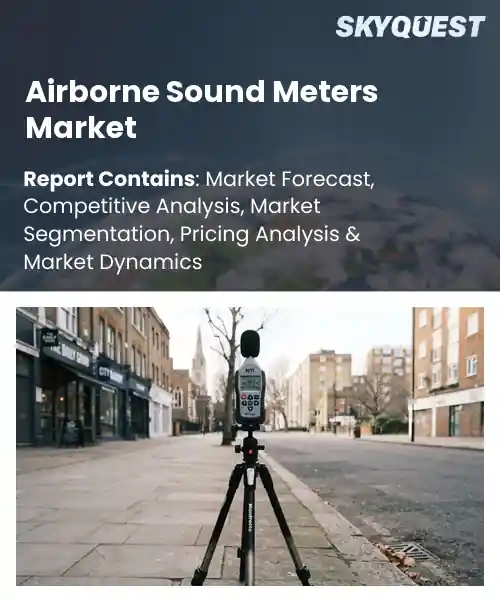
Airborne Sound Meters Market
Report ID: SQMIG45J2875
Report ID: SQMIG45J2875
[email protected]
USA +1 351-333-4748
Report ID:
SQMIG45J2875 |
Region:
Global |
Published Date: August, 2026
Pages:
157
|Tables:
143
|Figures:
78


Global Airborne Sound Meters Market size was valued at USD 364.7 Million in 2024 and is poised to grow from USD 388.41 Million in 2025 to USD 642.81 Million by 2033, growing at a CAGR of 6.5% during the forecast period (2026-2033).
The global airborne sound meter market comprises devices that quantify acoustic pressure in open environments, serving industries ranging from construction to environmental monitoring. Its importance lies in enforcing regulatory noise‑abatement legislation worldwide, which forces firms to adopt precise measurement tools. Historically, the market began as a niche segment for laboratory‑grade sound level meters in the 1970s, but the introduction of portable, IoT‑enabled units in the early 2000s accelerated adoption across municipal projects and wind‑farm assessments. Consequently, demand has shifted from occasional rentals to sustained purchases by both private contractors and public agencies seeking compliance and data-driven noise mitigation through innovation. Another pivotal factor reshaping the airborne sound meter market is the rapid integration of advanced analytics and cloud connectivity, which transforms raw acoustic data into actionable insights for stakeholders. As manufacturers embed AI algorithms that auto‑classify noise sources, users can instantly identify violations, schedule corrective actions, and benchmark performance across sites. This capability has opened lucrative opportunities in smart city initiatives, where continuous monitoring networks feed municipal dashboards to manage traffic, construction, and nightlife noise. In the renewable‑energy sector, operators now deploy networked meters on turbine farms to assess acoustic impact on wildlife, thereby securing permits more efficiently for growth.
How is AI enhancing accuracy and data analytics in the airborne sound meters market?
AI is reshaping airborne sound meters by embedding intelligent signal processing directly into the sensor hardware. Machine learning models learn the acoustic signature of common sources, allowing the device to separate true noise events from wind or traffic interference. Real time analytics convert raw decibel data into actionable insights such as source identification, trend mapping and compliance alerts. Cloud connectivity lets users aggregate measurements from multiple sites, enabling comparative studies and predictive maintenance. As regulators tighten noise standards, manufacturers are prioritising AI driven calibration that self adjusts to temperature and humidity changes, thereby raising confidence in field readings and expanding adoption across construction, transportation and urban planning projects.Larson Davis March 2024, introduced an AI enhanced acoustic analyzer that automatically classifies noise sources and adjusts calibration on the fly. This innovation cuts setup time, improves measurement reliability and accelerates compliance reporting, supporting deployment in diverse industrial applications and reinforcing market growth as users seek smarter, faster sound monitoring solutions.
Market snapshot - (2026-2033)
Global Market Size
USD 364.7 Million
Largest Segment
Class 1 Sound Meters
Fastest Growth
Real-Time Sound Analyzers
Growth Rate
6.5% CAGR
To get more insights on this market click here to Request a Free Sample Report
Global airborne sound meters market is segmented by meter type, application, operation, end user, connectivity and region. Based on meter type, the market is segmented into Class 1 Sound Meters, Class 2 Sound Meters and Real-Time Sound Analyzers. Based on application, the market is segmented into Environmental Monitoring, Industrial Noise Measurement, Building Acoustics and Aviation. Based on operation, the market is segmented into Handheld and Fixed. Based on end user, the market is segmented into Government Agencies, Industrial Facilities and Research Institutes. Based on connectivity, the market is segmented into Wired and Wireless. Based on region, the market is segmented into North America, Europe, Asia Pacific, Latin America and Middle East & Africa.
Class 1 Sound Meters segment dominates because they meet strict calibration standards required for most regulatory compliance, offering high accuracy with simple operation. Their ability to provide reliable single point measurements makes them the default choice for routine noise assessments across varied environments. Manufacturers focus on cost effective production, keeping unit prices attractive and encouraging widespread deployment by governmental and industrial users. This blend of performance, affordability, and compliance support sustains their leading market position.
However, Real Time Sound Analyzers segment emerges as the most rapidly expanding because advanced digital processing enables continuous spectrum monitoring, supporting complex source identification and predictive modeling. Growing adoption of smart city initiatives and integrated noise management platforms drives demand for these capabilities, positioning the technology as a catalyst for new service offerings and market diversification.
Wireless segment dominates because it eliminates the constraints of cable routing, allowing technicians to conduct measurements in hard to reach locations and support onsite data streaming. Seamless integration with cloud platforms and mobile applications enhances real time reporting, meeting the expectations of modern regulatory frameworks and client transparency. The convenience of remote configuration and battery powered operation reduces deployment time, making wireless devices the preferred choice across diverse operational contexts.
On the other hand, Wired segment is witnessing the strongest growth momentum because industrial facilities demand interference free connections for continuous long term monitoring. Ethernet and fiber advances deliver high bandwidth and reliability, meeting precise data logging needs for audits. This appeal drives installations, expanding wired networks and creating avenues for acoustic management solutions.
To get detailed segments analysis, Request a Free Sample Report
North America commands market leadership through a convergence of sophisticated regulatory environments, deep investment in acoustic research, and a concentration of original equipment manufacturers that prioritize precision measurement. The United States benefits from extensive industrial infrastructure, widespread adoption of noise‑control standards in construction, transportation, and manufacturing, while academic institutions feed a pipeline of talent specialized in sound engineering. Canada complements this strength with strong environmental policies and a growing emphasis on sustainable urban development, driving demand for accurate airborne sound monitoring. Together, the region’s advanced supply chains, proactive compliance frameworks, and commitment to innovation create a resilient ecosystem that consistently outpaces other geographies in product development, customer adoption, and value generation. Moreover, the collaborative culture between manufacturers and research institutions also accelerates the rollout of next‑generation sensor technologies, reinforcing the region’s position as a reference market for global players seeking to benchmark performance and reliability.
Airborne Sound Meters Market in United States thrives on a robust ecosystem that blends stringent occupational safety guidelines with a strong tradition of engineering excellence. Leading manufacturers collaborate closely with construction and transportation firms to integrate real‑time monitoring solutions, while academia drives continuous improvement through cutting‑edge research. This synergy fuels rapid product iteration and widespread deployment across urban development projects, industrial plants, and infrastructure renewal initiatives across diverse regulatory contexts.
Airborne Sound Meters Market in Canada is propelled by proactive environmental legislation that emphasizes noise mitigation in both urban and rural settings. Collaborative networks linking provincial agencies, research institutes, and equipment suppliers enable tailored solutions for community monitoring and industrial compliance. The emphasis on sustainable infrastructure projects and the growing awareness of acoustic health impacts encourage continuous adoption of advanced measurement devices across municipalities, energy facilities, and transportation corridors nationwide.
Europe experiences rapid expansion as a result of harmonized acoustic regulations, heightened public concern over environmental noise, and substantial investment in smart city initiatives. The European Union’s common standards create a level playing field that accelerates technology diffusion across member states, while national policies in key economies incentivize the deployment of precise monitoring tools in transport hubs, construction zones, and residential districts. Strong academic research clusters in Germany, the United Kingdom, and France feed innovation pipelines, delivering sensor miniaturization and data‑analytics capabilities that meet emerging compliance demands. Moreover, the integration of airborne sound data into broader environmental monitoring platforms enhances policy effectiveness and supports the continent’s ambition to achieve quieter, healthier urban environments.
Airborne Sound Meters Market in Germany benefits from world‑class engineering expertise and a regulatory framework that mandates rigorous noise assessments for industrial and infrastructure projects. Close cooperation between manufacturers and technical universities drives continuous refinement of sensor accuracy and data integration. This environment supports extensive deployment across automotive testing facilities, renewable energy sites, and densely populated cities, reinforcing Germany’s reputation as a benchmark for precision acoustic measurement in Europe nationwide.
Airborne Sound Meters Market in United Kingdom is propelled by legislative targets for noise reduction and a thriving ecosystem of startups developing IoT acoustic sensors. Collaborative pilots with transport authorities and heritage bodies demonstrate real‑time monitoring benefits for commuters and historic sites. Emphasis on data transparency and public engagement accelerates adoption across construction, rail networks, and community noise mapping, positioning United Kingdom as a leader in dynamic sound management nationwide.
Airborne Sound Meters Market in France is emerging amidst growing attention to urban livability and a national agenda that integrates acoustic monitoring into public health strategies. Partnerships between French research institutes and equipment firms focus on sensors suited for cityscapes and zones. Early adoption in airport perimeter controls, roadworks, and preservation projects illustrates a commitment to expanding acoustic data coverage, laying the groundwork for broader market penetration across the country.
Asia Pacific is strengthening its position by harnessing rapid industrial growth, heightened awareness of occupational noise hazards, and strategic government initiatives that promote smart environmental monitoring. Japan leverages its legacy of precision engineering to produce highly reliable acoustic sensors, while South Korea accelerates adoption through aggressive investment in connected device ecosystems. Regional collaborations among manufacturers, universities, and infrastructure developers foster the creation of compact, AI‑enabled meters that can be deployed in dense urban corridors, manufacturing plants, and transport hubs. This convergence of policy support, technical expertise, and market demand enables the region to emerge as a pivotal source of innovation and a growing consumer base for advanced airborne sound measurement solutions. Furthermore, increasing cross‑border trade in sensor components and joint research programs amplify the pace of standardization and cost reduction across the market.
Airborne Sound Meters Market in Japan thrives on a tradition of engineering and strong governmental emphasis on workplace health. Partnerships between leading electronics firms and acoustic research institutes drive the creation of sensors optimized for construction and railway testing. The focus on reliability and integration with data platforms supports deployment in urban noise mapping, manufacturing safety programs, and disaster‑response monitoring, reinforcing Japan’s reputation as a benchmark for precision sound measurement.
Airborne Sound Meters Market in South Korea is driven by national policies that connect smart city initiatives with environmental monitoring. Local manufacturers work with telecom firms to embed acoustic sensors in 5G networks, providing real‑time noise data for traffic and industrial areas. Focus on AI‑based analysis improves predictive maintenance and regulatory compliance, while government pilots in cities show public‑health benefits, establishing South Korea as a hub for sound measurement technology.
To know more about the market opportunities by region and country, click here to
Buy The Complete Report
Increasing Environmental Monitoring Requirements
Advancements In Sensor Miniaturization Technology
High Initial Capital Investment Costs
Stringent Calibration and Certification Standards
Request Free Customization of this report to help us to meet your business objectives.
The competitive landscape is shaped by established manufacturers expanding through strategic acquisitions, such as Brüel & Kjær’s purchase of Norsonic’s sensor division, and partnerships that integrate sound meters with IoT platforms, exemplified by Rion’s collaboration with Microsoft Azure for real‑time data analytics; meanwhile, firms are accelerating tech innovation by embedding AI algorithms for predictive noise monitoring, driving differentiation and market entry barriers.
Top Player’s Company Profile
Recent Developments
SkyQuest’s ABIRAW (Advanced Business Intelligence, Research & Analysis Wing) is our Business Information Services team that Collects, Collates, Correlates, and Analyses the Data collected by means of Primary Exploratory Research backed by robust Secondary Desk research. As per SkyQuest analysis, the global airborne sound meters market is being propelled by increasing environmental monitoring requirements, which push firms to adopt more accurate devices for regulatory compliance. A second catalyst is the rapid advancement in sensor miniaturization and wireless cloud‑based analytics that lower operational effort and enable real‑time insights. However, high initial capital investment costs can deter smaller players and slow broader adoption. North America remains the dominant region, driven by stringent noise standards, robust supply chains and strong R&D activity. Within the market, Class 1 sound meters hold the largest share thanks to their proven accuracy, affordability and compliance suitability.
| Report Metric | Details |
|---|---|
| Market size value in 2024 | USD 364.7 Million |
| Market size value in 2033 | USD 642.81 Million |
| Growth Rate | 6.5% |
| Base year | 2024 |
| Forecast period | (2026-2033) |
| Forecast Unit (Value) | USD Million |
| Segments covered |
|
| Regions covered | North America (US, Canada), Europe (Germany, France, United Kingdom, Italy, Spain, Rest of Europe), Asia Pacific (China, India, Japan, Rest of Asia-Pacific), Latin America (Brazil, Rest of Latin America), Middle East & Africa (South Africa, GCC Countries, Rest of MEA) |
| Companies covered |
|
| Customization scope | Free report customization with purchase. Customization includes:-
|
To get a free trial access to our platform which is a one stop solution for all your data requirements for quicker decision making. This platform allows you to compare markets, competitors who are prominent in the market, and mega trends that are influencing the dynamics in the market. Also, get access to detailed SkyQuest exclusive matrix.
Table Of Content
Executive Summary
Market overview
Parent Market Analysis
Market overview
Market size
KEY MARKET INSIGHTS
COVID IMPACT
MARKET DYNAMICS & OUTLOOK
Market Size by Region
KEY COMPANY PROFILES
Methodology
For the Airborne Sound Meters Market, our research methodology involved a mixture of primary and secondary data sources. Key steps involved in the research process are listed below:
1. Information Procurement: This stage involved the procurement of Market data or related information via primary and secondary sources. The various secondary sources used included various company websites, annual reports, trade databases, and paid databases such as Hoover's, Bloomberg Business, Factiva, and Avention. Our team did 45 primary interactions Globally which included several stakeholders such as manufacturers, customers, key opinion leaders, etc. Overall, information procurement was one of the most extensive stages in our research process.
2. Information Analysis: This step involved triangulation of data through bottom-up and top-down approaches to estimate and validate the total size and future estimate of the Airborne Sound Meters Market.
3. Report Formulation: The final step entailed the placement of data points in appropriate Market spaces in an attempt to deduce viable conclusions.
4. Validation & Publishing: Validation is the most important step in the process. Validation & re-validation via an intricately designed process helped us finalize data points to be used for final calculations. The final Market estimates and forecasts were then aligned and sent to our panel of industry experts for validation of data. Once the validation was done the report was sent to our Quality Assurance team to ensure adherence to style guides, consistency & design.
Analyst Support
Customization Options
With the given market data, our dedicated team of analysts can offer you the following customization options are available for the Airborne Sound Meters Market:
Product Analysis: Product matrix, which offers a detailed comparison of the product portfolio of companies.
Regional Analysis: Further analysis of the Airborne Sound Meters Market for additional countries.
Competitive Analysis: Detailed analysis and profiling of additional Market players & comparative analysis of competitive products.
Go to Market Strategy: Find the high-growth channels to invest your marketing efforts and increase your customer base.
Innovation Mapping: Identify racial solutions and innovation, connected to deep ecosystems of innovators, start-ups, academics, and strategic partners.
Category Intelligence: Customized intelligence that is relevant to their supply Markets will enable them to make smarter sourcing decisions and improve their category management.
Public Company Transcript Analysis: To improve the investment performance by generating new alpha and making better-informed decisions.
Social Media Listening: To analyze the conversations and trends happening not just around your brand, but around your industry as a whole, and use those insights to make better Marketing decisions.
REQUEST FOR SAMPLE
 REQUEST FREE CUSTOMIZATION


Want to customize this report? This report can be personalized according to your needs. Our analysts and industry experts will work directly with you to understand your requirements and provide you with customized data in a short amount of time. We offer $1000 worth of FREE customization at the time of purchase.
Feedback From Our Clients


 USA (+1) 351-333-4748

