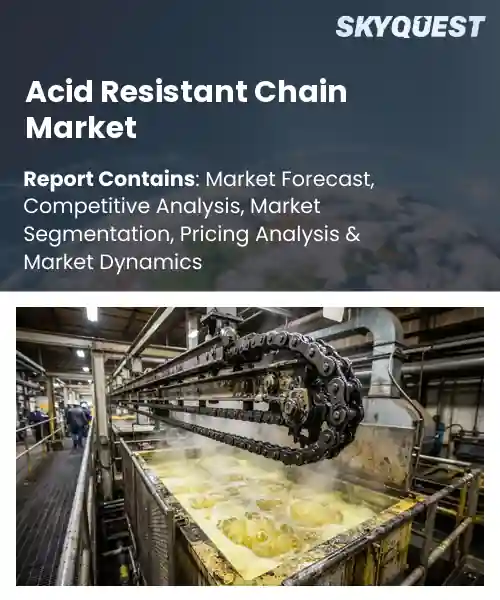
Acid Resistant Chain Market
Report ID: SQMIG20I3788
Report ID: SQMIG20I3788
[email protected]
USA +1 351-333-4748
Report ID:
SQMIG20I3788 |
Region:
Global |
Published Date: August, 2026
Pages:
157
|Tables:
145
|Figures:
78


Global Acid Resistant Chain Market size was valued at USD 468.3 Million in 2024 and is poised to grow from USD 495.93 Million in 2025 to USD 784.5 Million by 2033, growing at a CAGR of 5.9% during the forecast period (2026-2033).
The acid‑resistant chain market provides specially engineered links that survive harsh chemical exposure, a need for petrochemical, food, and wastewater facilities. Its importance lies in preventing costly unplanned shutdowns caused by corrosion, which drives operators toward longer‑lasting alloys. The sector began in the early 1990s when manufacturers blended stainless steel with molybdenum and nickel to tolerate sulfuric and hydrochloric acids. In the last ten years, environmental rules have compelled plants to upgrade equipment, illustrated by a recent Saudi refinery that swapped standard chains for duplex titanium versions. This progression shows the market’s transition from niche product to essential safety component. Building on that evolution, growth catalyst now resides in expanding demand for energy infrastructure, where acid‑resistant chains secure rotating equipment of electrolyzers and wind generators. When these systems operate in sulfur‑rich environments, conventional chains fail, prompting engineers to select duplex or alloy‑clad solutions that guarantee uninterrupted power output. This reliability directly translates into higher plant capacity factors, encouraging investors to fund projects and thereby enlarging supplier base. Emerging applications such as hydrogen production in Saudi Arabia and refineries in Brazil illustrate how durability requirements open markets, while advances in manufacturing promise to lower production costs and accelerate adoption across sector.
How is AI-driven automation influencing the acid‑resistant chain market?
AI-driven automation is reshaping the acid‑resistant chain market by streamlining design, production and quality control. Intelligent sensors monitor wear and corrosion in real time, feeding data into predictive models that adjust machining parameters on the fly. Machine‑learning algorithms optimize material blends, reducing scrap and shortening lead times. Integrated robotics handle heavy lifting and assembly, minimizing human exposure to hazardous environments while boosting throughput. These technologies collectively enhance reliability, lower costs and accelerate delivery, making manufacturers more responsive to the demanding needs of chemical processing and metalworking sectors.In June 2026, a leading acid‑resistant chain producer announced an AI‑enhanced manufacturing line, demonstrating how automation improves product consistency and supports market growth.
Market snapshot - (2026-2033)
Global Market Size
USD 468.3 Million
Largest Segment
Roller Chains
Fastest Growth
Specialty Chains
Growth Rate
5.9% CAGR
To get more insights on this market click here to Request a Free Sample Report
Global acid resistant chain market is segmented by chain type, material, application, end user, distribution channel and region. Based on chain type, the market is segmented into Roller Chains, Conveyor Chains, Leaf Chains and Specialty Chains. Based on material, the market is segmented into Stainless Steel, Nickel Alloy and Coated Steel. Based on application, the market is segmented into Chemical Processing, Food & Beverage, Water Treatment and Mining. Based on end user, the market is segmented into Industrial Manufacturing, Chemical Industry and Marine. Based on distribution channel, the market is segmented into OEM and Aftermarket. Based on region, the market is segmented into North America, Europe, Asia Pacific, Latin America and Middle East & Africa.
Stainless steel segment dominates because its innate corrosion resistance aligns perfectly with the harsh acidic environments typical of chemical processing equipment. The alloy’s stability reduces maintenance downtime, delivering reliable power transmission over extended service life. Manufacturers favor it for its predictable performance, ease of fabrication, and cost effectiveness relative to exotic materials, reinforcing its position as the preferred choice across the global industrial Acid Resistant Chain Market for customers today.
However, nickel alloy segment emerges as the fastest growing because alloy formulations offer superior resistance to aggressive acids while maintaining high tensile strength. Its adoption is accelerating as producers seek longer service intervals and lighter weight components, spurring innovation in chain design and opening new opportunities in chemical handling environments.
Water treatment segment dominates because acid neutralization units and corrosion prone pipelines require uninterrupted power transmission that can survive low pH environments. Chains designed for this sector provide exceptional durability, minimizing replacements and downtime, which is critical for continuous water quality compliance. The sector’s strict operational standards and preference for proven, low maintenance solutions reinforce the reliance on acid resistant chains, cementing water treatment as the leading driver in the market global today.
Meanwhile, mining segment emerges as the fastest growing because expanding ore extraction in acidic leach processes demands chains that can endure extreme chemical exposure. Operators are adopting acid resistant solutions to reduce equipment failure and investments in mine automation amplify demand, positioning mining as a catalyst for the overall market.
To get detailed segments analysis, Request a Free Sample Report
North America maintains a leading position in the global Acid Resistant Chain Market due to a combination of mature manufacturing capabilities, strong demand from heavy‑industry sectors, and a well‑developed supply chain ecosystem. The United States benefits from deep engineering expertise, advanced material science research, and a concentration of end‑users in sectors such as chemical processing and mining that require highly durable transmission solutions. Canada contributes with its emphasis on high‑quality production standards, skilled labor force, and strategic proximity to key North American customers. Collaborative innovation between industrial players and academic institutions accelerates product enhancements, while a regulatory environment that supports safety and environmental compliance further reinforces market leadership. These factors collectively generate a resilient demand base and enable North America to set performance benchmarks that are adopted worldwide.
Acid Resistant Chain Market in the United States benefits from a concentrated cluster of OEMs that integrate alloy technologies with testing protocols. Close collaboration between producers and end‑users drives improvements in corrosion resistance and load‑bearing capacity. Government support for advanced manufacturing reinforces investment in research facilities, while stringent quality certifications ensure consistent performance. These attributes position the United States as a benchmark for reliability, attracting demand from domestic and international customers seeking chain solutions.
Acid Resistant Chain Market in Canada is characterized by an emphasis on precision engineering and adherence to rigorous quality frameworks. Collaborative networks linking material scientists with manufacturers foster development of corrosion‑resistant alloys tailored to local industrial demands. A regulatory landscape promotes environmental stewardship and safety, encouraging adoption of advanced chain solutions. These dynamics reinforce Canada’s reputation as a dependable source of high‑performance acid‑resistant products within the broader North American market.
The European Acid Resistant Chain Market is propelled by stringent environmental regulations, advanced material research, and a dense network of specialized manufacturers. Germany leads with its deep engineering expertise and robust supply chains that serve automotive, chemical, and heavy‑machinery sectors. The United Kingdom accelerates growth through targeted investments in high‑performance alloy research and a proactive industrial policy that encourages rapid adoption of durable transmission components. France contributes emerging capabilities by leveraging its focus on sustainable manufacturing practices and increasing adoption of corrosion‑resistant solutions in infrastructure projects. Cross‑border trade within the region facilitates technology transfer, while a shared commitment to safety and durability enhances product credibility. Industry associations also promote harmonized standards and digital monitoring tools that streamline maintenance, further reinforcing Europe’s position as a leader in resilient chain solutions.
Acid Resistant Chain Market in Germany benefits from a tradition of precision engineering and an integrated supplier ecosystem. Close cooperation between alloy producers and heavy‑industry users drives improvements in corrosion resistance and load‑bearing capacity. Government support for advanced manufacturing reinforces investment in research facilities, while stringent quality certifications ensure consistent performance. These attributes position Germany as a benchmark for reliability, attracting demand from domestic and international customers seeking chain solutions.
Acid Resistant Chain Market in the United Kingdom is energized by investments in alloy research and an industrial policy that encourages adoption of durable transmission components. Collaboration between universities and manufacturers accelerates technology transfer, while a focus on production expands market reach. Regulatory frameworks emphasize safety and environmental stewardship, encouraging customers to upgrade to corrosion‑resistant chains. These dynamics fuel expansion, positioning the United Kingdom as a growth engine within Europe.
Acid Resistant Chain Market in France is emerging as manufacturers adopt production methods and integrate corrosion‑resistant technologies into infrastructure projects. Collaborative initiatives between research institutes and local fabricators support the development of alloys optimized for acidic environments, while government incentives promote the transition toward greener material handling solutions. Growing awareness of cost benefits drives acceptance among industrial users. Consequently, France is building a niche presence that complements European market dynamics.
Asia Pacific is advancing its role in the Acid Resistant Chain Market through a blend of manufacturing scale, rising industrial activity, and focused R&D initiatives. Japan leverages its legacy of precision engineering and a mature supply chain to deliver high‑quality corrosion‑resistant products for chemical and marine applications. South Korea emphasizes rapid technology adoption and strategic partnerships that accelerate the rollout of advanced alloy solutions. Growing demand from sectors such as petrochemicals, offshore drilling, and renewable energy drives investment in capacity expansion across the region. Collaborative platforms linking universities, research centers, and manufacturers foster innovation, while government policies that prioritize export competitiveness and environmental compliance support market growth. These elements collectively enhance Asia Pacific’s reputation as a reliable source of sophisticated acid‑resistant chain technologies for global customers.
Acid Resistant Chain Market in Japan is anchored by a heritage of precision manufacturing and metallurgical expertise. Leading firms integrate rigorous quality control with innovative alloy formulations to meet the exacting demands of chemical processing and marine logistics. Collaboration between research universities and industry accelerates the introduction of corrosion‑resistant solutions. Government support for manufacturing reinforces investment in production facilities, ensuring Japan maintains a reputation for delivering reliable chain products worldwide.
Acid Resistant Chain Market in South Korea is driven by adoption of alloy technologies and partnerships that accelerate product rollout. Domestic manufacturers focus on integrating corrosion resistance with high load capacity to serve petrochemical, offshore, and renewable energy sectors. Collaboration with research institutions fuels material innovation, while policies encourage penetration of markets. These factors combine to position South Korea as a contributor to the region’s growth in acid‑resistant chain solutions.
To know more about the market opportunities by region and country, click here to
Buy The Complete Report
Increasing Demand in Chemical Processing
Adoption of Advanced Coating Technologies
High Production Cost of Materials
Stringent Environmental Regulations
Request Free Customization of this report to help us to meet your business objectives.
The acid‑resistant chain market is shaped by intense competition among material innovators and supply‑chain specialists. Companies are leveraging large‑scale funding to accelerate corrosion‑resistant alloy development, while others pursue strategic partnerships to embed their chains into petrochemical logistics networks. Recent examples include Lila Sciences’ $350 million Series A in 2025 and GETASAP’s rollout of a real‑time logistics platform for acid‑handling facilities, illustrating how capital infusion and integration tactics drive market positioning.
Top Player’s Company Profile
Recent Developments
SkyQuest’s ABIRAW (Advanced Business Intelligence, Research & Analysis Wing) is our Business Information Services team that Collects, Collates, Correlates, and Analyses the Data collected by means of Primary Exploratory Research backed by robust Secondary Desk research. As per SkyQuest analysis, the global acid‑resistant chain market is propelled chiefly by a surge in chemical‑processing facilities that require corrosion‑proof power transmission, while the high production cost of premium alloys acts as a notable restraint. North America emerges as the dominant region, leveraging advanced manufacturing and a strong end‑user base, and the stainless‑steel material segment leads the market due to its balanced performance and cost efficiency. A second driver strengthening growth is the rapid adoption of advanced coating technologies, which enhance durability and lower replacement cycles, further encouraging investment in robust chain solutions strategically across the sector and future‑proofing operations.
| Report Metric | Details |
|---|---|
| Market size value in 2024 | USD 468.3 Million |
| Market size value in 2033 | USD 784.5 Million |
| Growth Rate | 5.9% |
| Base year | 2024 |
| Forecast period | (2026-2033) |
| Forecast Unit (Value) | USD Million |
| Segments covered |
|
| Regions covered | North America (US, Canada), Europe (Germany, France, United Kingdom, Italy, Spain, Rest of Europe), Asia Pacific (China, India, Japan, Rest of Asia-Pacific), Latin America (Brazil, Rest of Latin America), Middle East & Africa (South Africa, GCC Countries, Rest of MEA) |
| Companies covered |
|
| Customization scope | Free report customization with purchase. Customization includes:-
|
To get a free trial access to our platform which is a one stop solution for all your data requirements for quicker decision making. This platform allows you to compare markets, competitors who are prominent in the market, and mega trends that are influencing the dynamics in the market. Also, get access to detailed SkyQuest exclusive matrix.
Table Of Content
Executive Summary
Market overview
Parent Market Analysis
Market overview
Market size
KEY MARKET INSIGHTS
COVID IMPACT
MARKET DYNAMICS & OUTLOOK
Market Size by Region
KEY COMPANY PROFILES
Methodology
For the Acid Resistant Chain Market, our research methodology involved a mixture of primary and secondary data sources. Key steps involved in the research process are listed below:
1. Information Procurement: This stage involved the procurement of Market data or related information via primary and secondary sources. The various secondary sources used included various company websites, annual reports, trade databases, and paid databases such as Hoover's, Bloomberg Business, Factiva, and Avention. Our team did 45 primary interactions Globally which included several stakeholders such as manufacturers, customers, key opinion leaders, etc. Overall, information procurement was one of the most extensive stages in our research process.
2. Information Analysis: This step involved triangulation of data through bottom-up and top-down approaches to estimate and validate the total size and future estimate of the Acid Resistant Chain Market.
3. Report Formulation: The final step entailed the placement of data points in appropriate Market spaces in an attempt to deduce viable conclusions.
4. Validation & Publishing: Validation is the most important step in the process. Validation & re-validation via an intricately designed process helped us finalize data points to be used for final calculations. The final Market estimates and forecasts were then aligned and sent to our panel of industry experts for validation of data. Once the validation was done the report was sent to our Quality Assurance team to ensure adherence to style guides, consistency & design.
Analyst Support
Customization Options
With the given market data, our dedicated team of analysts can offer you the following customization options are available for the Acid Resistant Chain Market:
Product Analysis: Product matrix, which offers a detailed comparison of the product portfolio of companies.
Regional Analysis: Further analysis of the Acid Resistant Chain Market for additional countries.
Competitive Analysis: Detailed analysis and profiling of additional Market players & comparative analysis of competitive products.
Go to Market Strategy: Find the high-growth channels to invest your marketing efforts and increase your customer base.
Innovation Mapping: Identify racial solutions and innovation, connected to deep ecosystems of innovators, start-ups, academics, and strategic partners.
Category Intelligence: Customized intelligence that is relevant to their supply Markets will enable them to make smarter sourcing decisions and improve their category management.
Public Company Transcript Analysis: To improve the investment performance by generating new alpha and making better-informed decisions.
Social Media Listening: To analyze the conversations and trends happening not just around your brand, but around your industry as a whole, and use those insights to make better Marketing decisions.
REQUEST FOR SAMPLE
 REQUEST FREE CUSTOMIZATION


Want to customize this report? This report can be personalized according to your needs. Our analysts and industry experts will work directly with you to understand your requirements and provide you with customized data in a short amount of time. We offer $1000 worth of FREE customization at the time of purchase.
Feedback From Our Clients


 USA (+1) 351-333-4748

